

Question: Not sure where to begin with this! Can someone help please! :) Make a scatter plot for the given data. Use the scatter plot to
Not sure where to begin with this! Can someone help please! :)
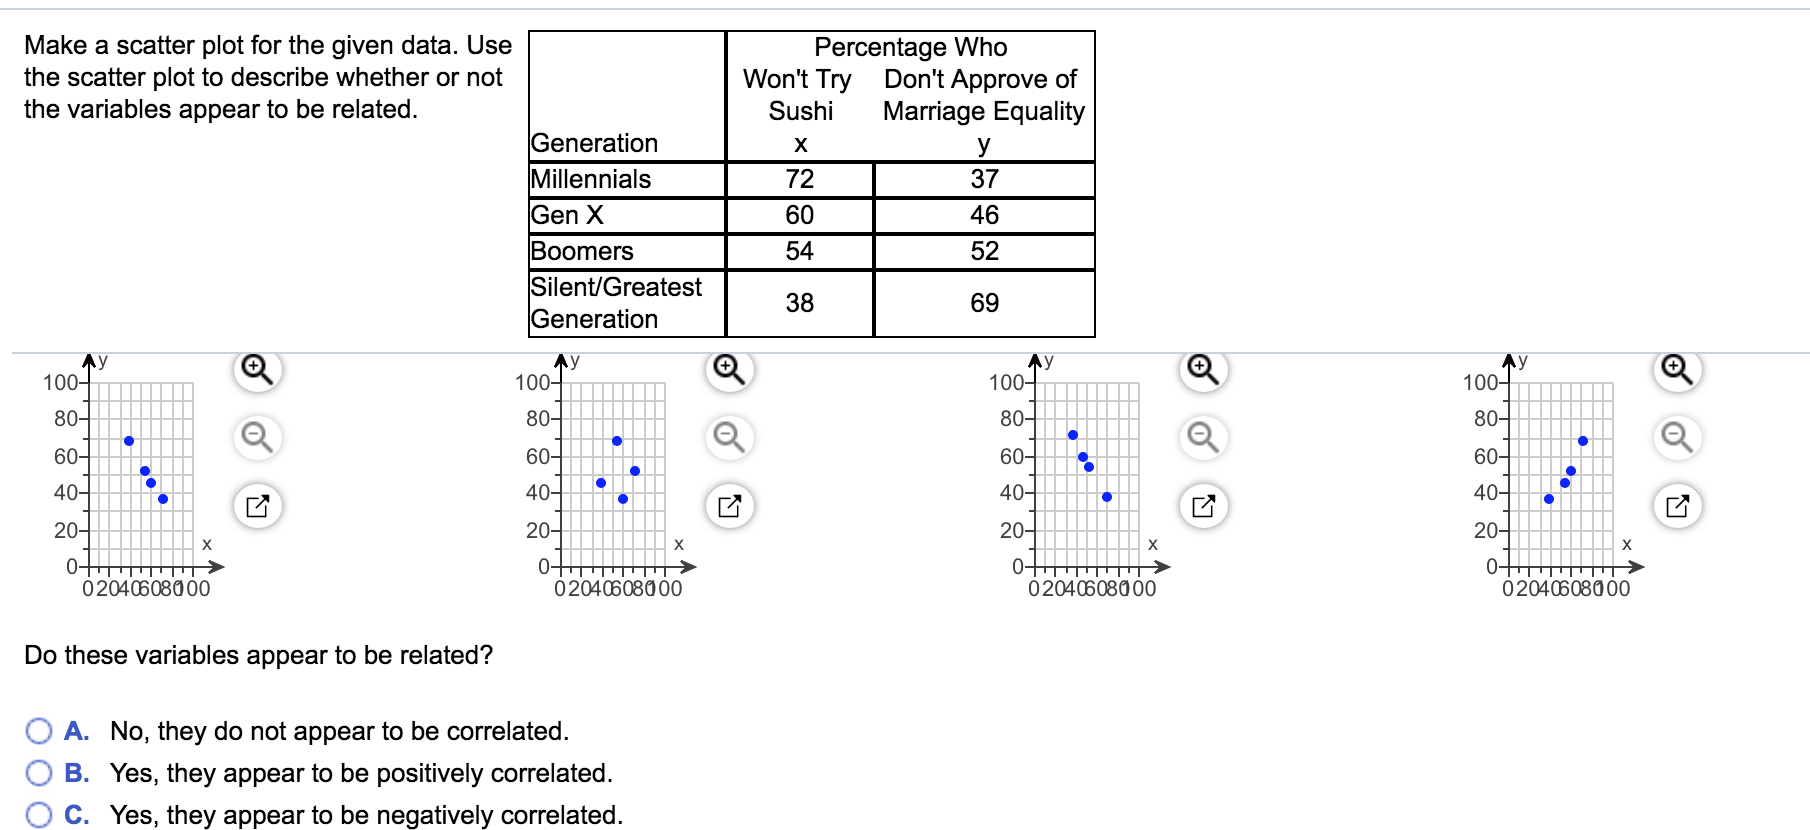
Make a scatter plot for the given data. Use the scatter plot to describe whether or not the variables appear to be related. Sushi Percentage Who Won't Try Don't Approve of Marriage Equality 100 80 60 40 20 0 204CBCBO 00 0 204CBCBOOO Do these variables appear to be related? 0 A. No, they do not appear to be correlated. O B. Yes, they appear to be positively correlated. O C. Yes, they appear to be negatively correlated. 100 100 80 80 60 60 40 4O 20 20 0 0 0204(BCBOOO 0204CBC8000
Step by Step Solution
There are 3 Steps involved in it
1 Expert Approved Answer
Step: 1 Unlock

Question Has Been Solved by an Expert!
Get step-by-step solutions from verified subject matter experts
Step: 2 Unlock
Step: 3 Unlock