

Question: Not using excel. Please show all steps. Requirements: Calculate forecast and mean absolute deviation (MAD) using, 1. Moving Average 2. Exponential Smoothing 3. Trend line
Not using excel. Please show all steps.
Requirements: Calculate forecast and mean absolute deviation (MAD) using, 1. Moving Average 2. Exponential Smoothing 3. Trend line
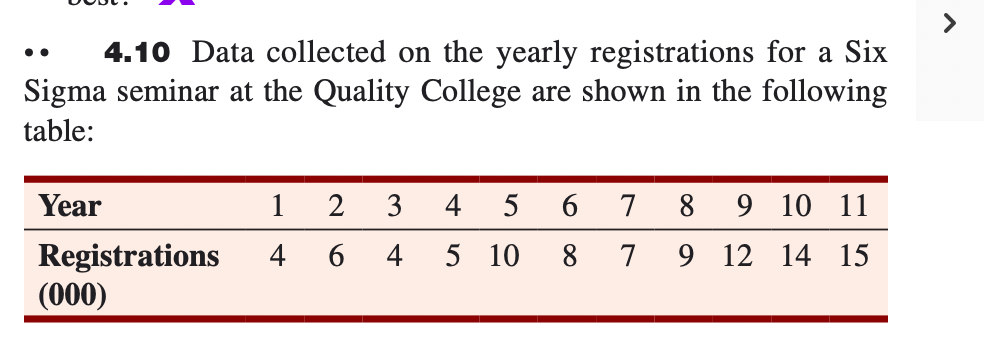
4.10 Data collected on the yearly registrations for a Six Sigma seminar at the Quality College are shown in the following table: Year 1 2 3 4 5 6 7 8 9 10 11 4 6 4 5 10 8 7 9 12 14 15 Registrations (000)Step by Step Solution
There are 3 Steps involved in it
1 Expert Approved Answer
Step: 1 Unlock

Question Has Been Solved by an Expert!
Get step-by-step solutions from verified subject matter experts
Step: 2 Unlock
Step: 3 Unlock