

Question: Note: 1- Handwriting, word, or excel are accepted. 2- Formatting numbers with two decimal places for all values, 3- Upload the results into the D2L
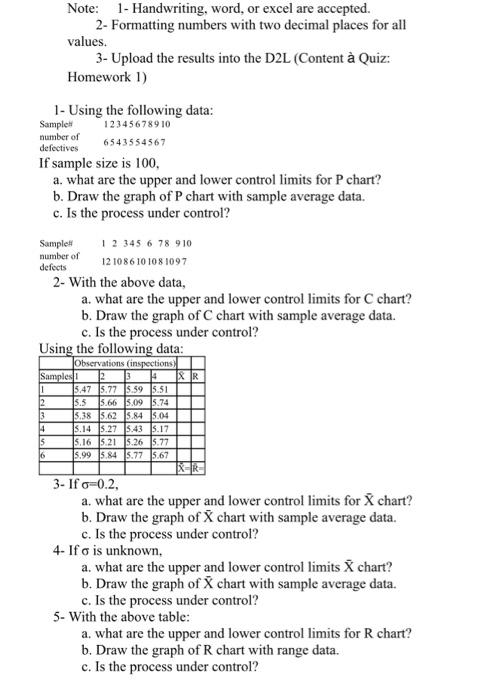
Note: 1- Handwriting, word, or excel are accepted. 2- Formatting numbers with two decimal places for all values, 3- Upload the results into the D2L (Content Quiz: Homework 1) 1- Using the following data: Gamples 12345678910 number of 6543554567 If sample size is 100 , a. what are the upper and lower control limits for P chart? b. Draw the graph of P chart with sample average data. c. Is the process under control? Sampled 12345678910 number of defects 121086101081097 2- With the above data, a. what are the upper and lower control limits for C chart? b. Draw the graph of C chart with sample average data. c. Is the process under control? Ising the following data: 3- If =0.2, a. what are the upper and lower control limits for X chart? b. Draw the graph of X chart with sample average data. c. Is the process under control? 4- If is unknown, a. what are the upper and lower control limits X chart? b. Draw the graph of X chart with sample average data. c. Is the process under control? 5- With the above table: a. what are the upper and lower control limits for R chart? b. Draw the graph of R chart with range data. c. Is the process under control
Step by Step Solution
There are 3 Steps involved in it

Get step-by-step solutions from verified subject matter experts