

Question: Note: According to the economic theory, all the provided variables in below table have relationship with gross domestic production (GDP). To answer the following questions,

Note: According to the economic theory, all the provided variables in below table have relationship with gross domestic production (GDP). To answer the following questions, you should start to select a country and variables from this link (http://databank.worldbank.org/data/reports.aspx?source=2&country#).
Please use Microsoft Excel in solving the question.
QUESTION 1.
Please select two variables (one dependent and one independent variable) between 2010-2018.
A) What are the descriptive statistics of selected variables such as mean, median, standard deviation, sample variance, and range.
B) Plot each variable over the time and shows the trendline with equation.
C) Run the simple regression and shows the liner equation between variables. What is the intercept and slope? Which one is statistically significant?
QUESTION 2.
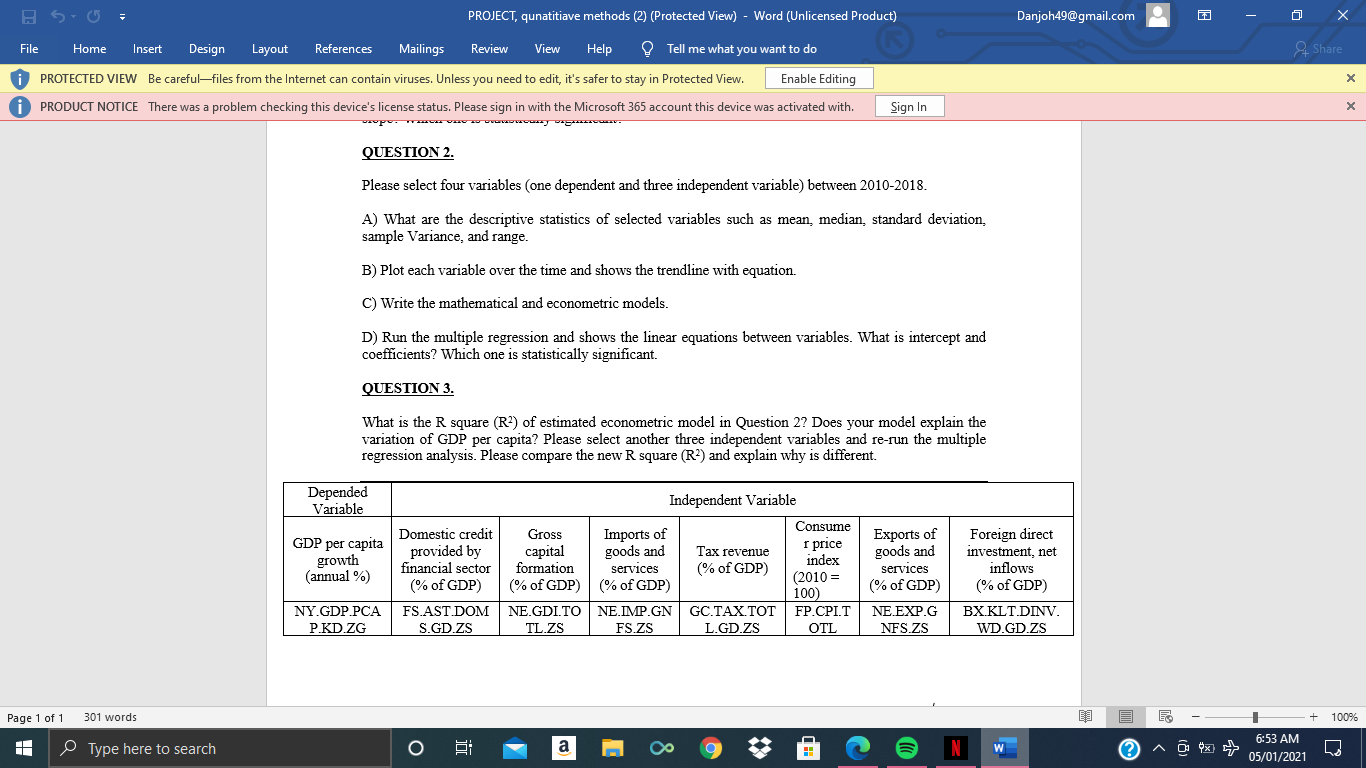
Please select four variables (one dependent and three independent variable) between 2010-2018.
A) What are the descriptive statistics of selected variables such as mean, median, standard deviation, sample Variance, and range.
B) Plot each variable over the time and shows the trendline with equation.
C) Write the mathematical and econometric models.
D) Run the multiple regression and shows the linear equations between variables. What is intercept and coefficients? Which one is statistically significant.
PROJECT, qunatitiave methods (2) (Protected View) - Word (Unlicensed Product) Danjoh49@gmail.com X File Home Insert Design Layout References Mailings Review View Help Tell me what you want to do Share i PROTECTED VIEW Be careful-files from the Internet can contain viruses. Unless you need to edit, it's safer to stay in Protected View. Enable Editing X i PRODUCT NOTICE There was a problem checking this device's license status. Please sign in with the Microsoft 365 account this device was activated with. Sign In X QUESTION 2. Please select four variables (one dependent and three independent variable) between 2010-2018. A) What are the descriptive statistics of selected variables such as mean, median, standard deviation, sample Variance, and range. B) Plot each variable over the time and shows the trendline with equation. C) Write the mathematical and econometric models. D) Run the multiple regression and shows the linear equations between variables. What is intercept and coefficients? Which one is statistically significant. QUESTION 3. What is the R square (R?) of estimated econometric model in Question 2? Does your model explain the variation of GDP per capita? Please select another three independent variables and re-run the multiple regression analysis. Please compare the new R square (R?) and explain why is different. Depended Variable Independent Variable Consume Domestic credit Gross Imports of Exports of Foreign direct GDP per capita provided by capital goods and Tax revenue price index goods and investment, net growth formation services (annual %) financial sector services (% of GDP) inflows 2010 = (% of GDP) (% of GDP) (% of GDP) 100) (% of GDP) (% of GDP) NY.GDP.PCA FS.AST.DOM NE.GDI.TO NE.IMP.GN GC.TAX.TOT FP.CPI.T NE.EXP.G BX.KLT.DINV. P.KD.ZG S.GD.ZS TL.ZS FS.ZS L.GD.ZS OTL NFS.ZS WD.GD.ZS Page 1 of 1 301 words + 100% 6:53 AM Type here to search O a N W ? A 05/01/2021
Step by Step Solution
There are 3 Steps involved in it

Get step-by-step solutions from verified subject matter experts