

Question: NOTE: CURVE FITTING IN EXCEL: In this assignment you will be doing curve fitting: The curve fitting process is an actually. fairly simple. Begin by
NOTE: CURVE FITTING IN EXCEL:
In this assignment you will be doing curve fitting: The curve fitting process is an actually. fairly simple. Begin by entering your data with, for instance, the value in the first column A and the value in the second column B and create a scatterplot. To fit a function to the data, right click on any of the data points and select the "Add Trendline" option. This gives you the choice of various families of functions, including Linear, Power, Exponential, and Polynomial. With most of the choices, you simply click on the desired icon. When you click on icon for polynomial, you need to specify the degree, from for a quadratic to Once you have selected the function you want, select the options to "Display Equation on the Chart" and "Display Rsquared value on chart" at the bottom. Finally select ok and Excel will display the desired regression function as well as its equation and the value of known as the coefficient of determination.
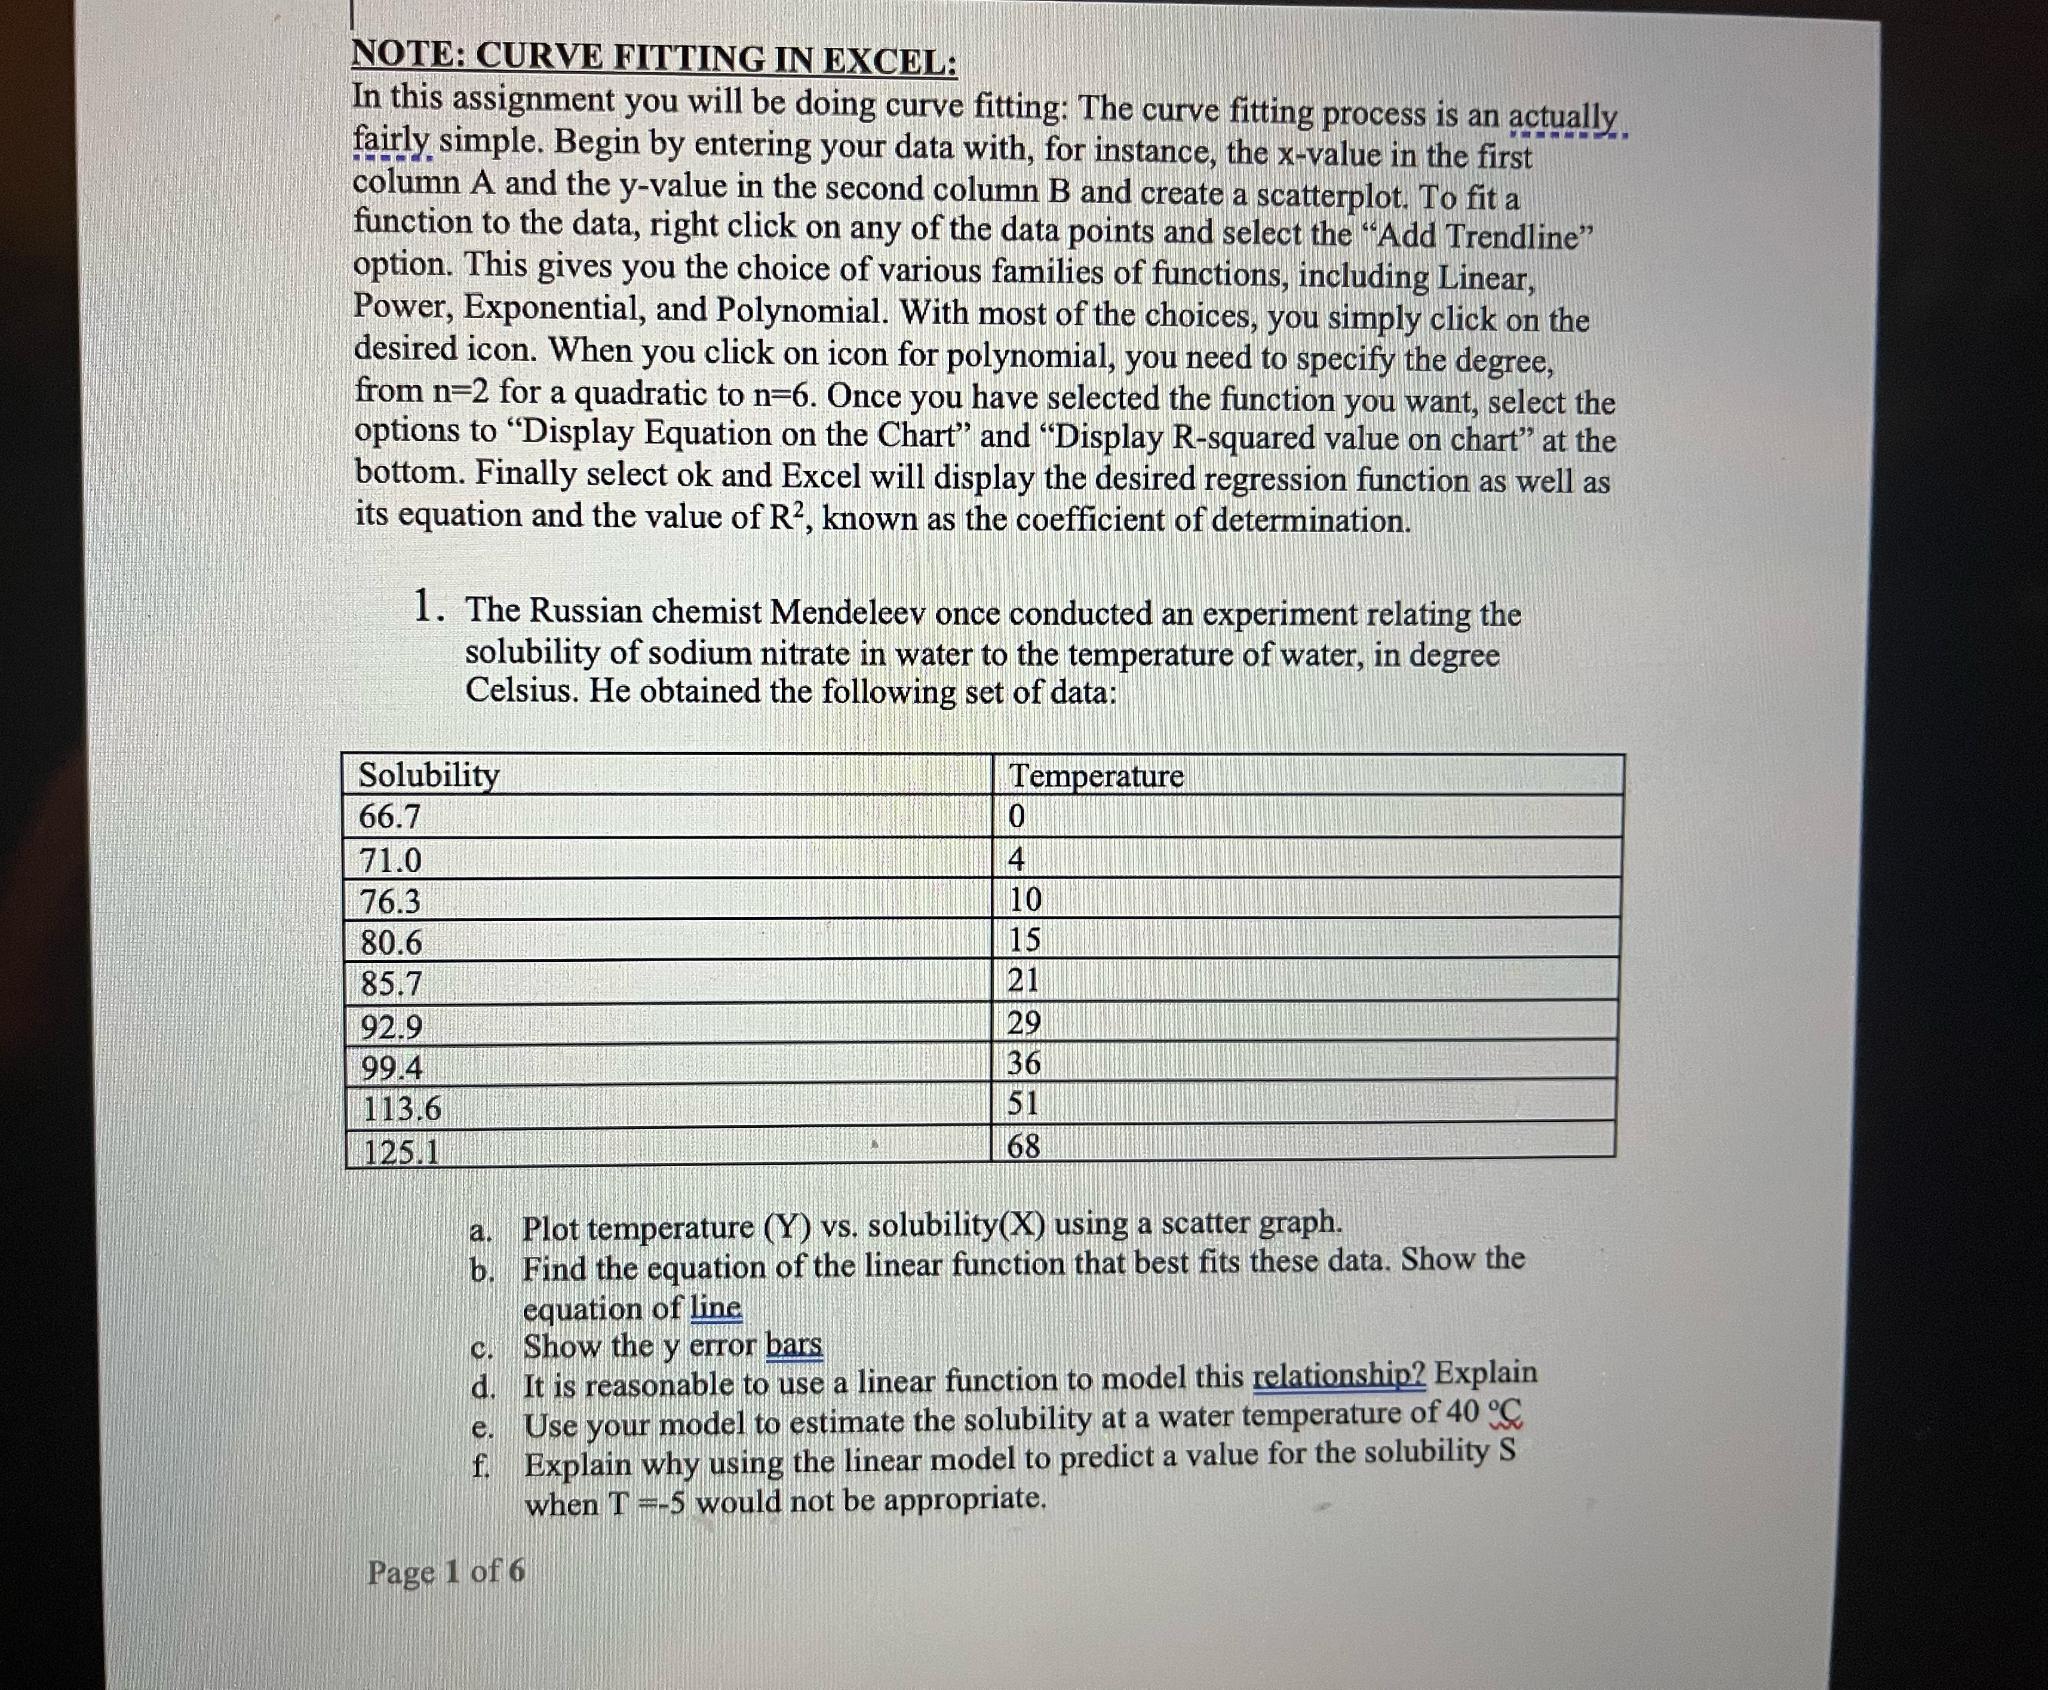
The Russian chemist Mendeleev once conducted an experiment relating the solubility of sodium nitrate in water to the temperature of water, in degree Celsius. He obtained the following set of data:
tableSolubilityTemperature
a Plot temperature vs solubility using a scatter graph.
b Find the equation of the linear function that best fits these data. Show the equation of line
c Show the y error bars
d It is reasonable to use a linear function to model this relationship? Explain
e Use your model to estimate the solubility at a water temperature of
f Explain why using the linear model to predict a value for the solubility when would not be appropriate.
Page of
Step by Step Solution
There are 3 Steps involved in it
1 Expert Approved Answer
Step: 1 Unlock

Question Has Been Solved by an Expert!
Get step-by-step solutions from verified subject matter experts
Step: 2 Unlock
Step: 3 Unlock