

Question: Note: don't use program calculations Note: please use a computer for typing (difficulty reading the script) thank The following data are from a two-factor study
Note: don't use program calculations
Note: please use a computer for typing (difficulty reading the script)
thank
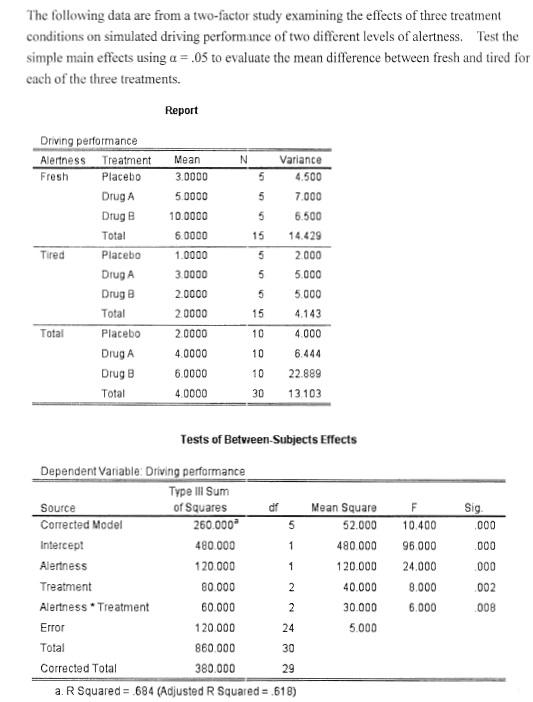
The following data are from a two-factor study examining the effects of three treatment conditions on simulated driving performance of two different levels of alertness. Test the simple main effects using a = .05 to evaluate the mean difference between fresh and tired for cach of the three treatments. Report N Mean 3.0000 5 5 5 15 5 Driving performance Alertness Treatment Fresh Placebo Drug A Drug Total Tired Placebo Drug A Drug B Total Total Placebo Druga Drug B Total 5 5.0000 10.0000 6.0000 1.0000 3.0000 2.0000 20000 2.0000 4.0000 6.0000 4.0000 Variance 4.500 7.000 6.500 14.429 2000 5.000 5.000 4.143 4.000 6.444 22.889 13 103 5 15 10 10 10 30 F 5 Tests of Between Subjects Effects Dependent Variable: Driving performance Type Ill Sum Source of Squares dr Mean Square Corrected Model 260.000 52.000 Intercept 480.000 480.000 Alertness 120.000 120.000 Treatment 80.000 40.000 Alertness Treatment 60.000 30.000 Error 120.000 24 5.000 Total 860.000 30 Corrected Total 380.000 29 a. R Squared = 684 (Adjusted R Squared = 618) 1 Sig .000 .000 000 10.400 96.000 24.000 8.000 6.000 1 2 002 2 008 The following data are from a two-factor study examining the effects of three treatment conditions on simulated driving performance of two different levels of alertness. Test the simple main effects using a = .05 to evaluate the mean difference between fresh and tired for cach of the three treatments. Report N Mean 3.0000 5 5 5 15 5 Driving performance Alertness Treatment Fresh Placebo Drug A Drug Total Tired Placebo Drug A Drug B Total Total Placebo Druga Drug B Total 5 5.0000 10.0000 6.0000 1.0000 3.0000 2.0000 20000 2.0000 4.0000 6.0000 4.0000 Variance 4.500 7.000 6.500 14.429 2000 5.000 5.000 4.143 4.000 6.444 22.889 13 103 5 15 10 10 10 30 F 5 Tests of Between Subjects Effects Dependent Variable: Driving performance Type Ill Sum Source of Squares dr Mean Square Corrected Model 260.000 52.000 Intercept 480.000 480.000 Alertness 120.000 120.000 Treatment 80.000 40.000 Alertness Treatment 60.000 30.000 Error 120.000 24 5.000 Total 860.000 30 Corrected Total 380.000 29 a. R Squared = 684 (Adjusted R Squared = 618) 1 Sig .000 .000 000 10.400 96.000 24.000 8.000 6.000 1 2 002 2 008
Step by Step Solution
There are 3 Steps involved in it

Get step-by-step solutions from verified subject matter experts