

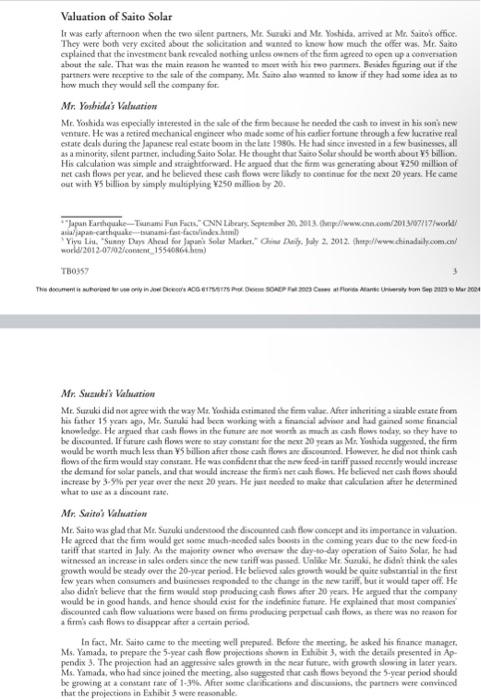
Question: Note :- First picture is the question and all next are references .. I want full answer for the question not just hints. begin{tabular}{|c|c|c|c|c|c|c|} hline
![\hline \multirow[b]{2}{*}{ Income Item } & \multirow{2}{*}{\begin{tabular}{r} Actual \\ 2012 \end{tabular}} &](https://dsd5zvtm8ll6.cloudfront.net/si.experts.images/questions/2024/09/66f7ea4a044fa_40166f7ea4997425.jpg)
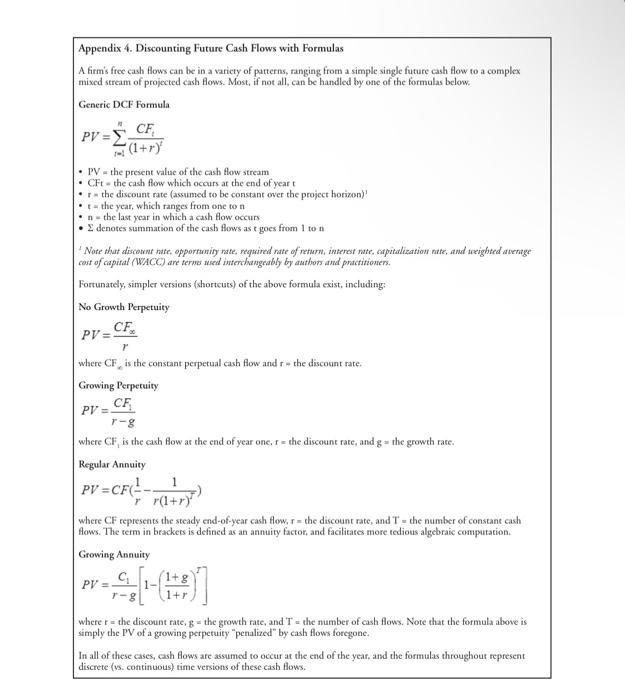
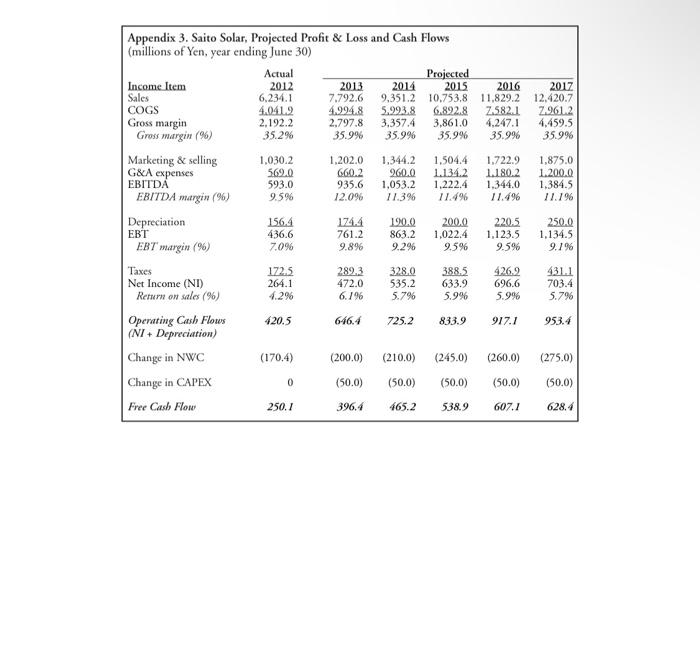
\begin{tabular}{|c|c|c|c|c|c|c|} \hline \multicolumn{7}{|c|}{\begin{tabular}{l} Appendix 3. Saito Solar, Projected Profit \& Loss and Cash Flows \\ (millions of Yen, year ending June 30) \end{tabular}} \\ \hline \multirow[b]{2}{*}{ Income Item } & \multirow{2}{*}{\begin{tabular}{r} Actual \\ 2012 \end{tabular}} & \multicolumn{5}{|c|}{ Projected } \\ \hline & & 2013 & 2014 & 2015 & 2016 & 2017 \\ \hline Sales & 6.234 .1 & 7.792 .6 & 9,351.2 & 10,753,8 & 11,829.2 & 12,420.7 \\ \hline COGS & 4,041.2 & 4.994 .8 & 5,993,8 & 6.892 .8 & 2582.1 & 2.961 .2 \\ \hline Gross margin & 2,192.2 & 2,797.8 & 3,357,4 & 3,861.0 & 4,247.1 & 4,459.5 \\ \hline Gross margin (\%) & 35.2% & 35.9% & 35.9% & 35.9% & 35.9% & 35.9% \\ \hline Marketing \& selling & 1,030.2 & 1,202.0 & 1,344.2 & 1,504.4 & 1,722.9 & 1,875.0 \\ \hline G\&A expenses & 569.0 & 660.2 & 260.0 & 1.134 .2 & 1.180 .2 & 1.200 .0 \\ \hline EBITDA & 593.0 & 935.6 & 1,053.2 & 1,222.4 & 1,344.0 & 1,384.5 \\ \hline EBITDA margin (\%) & 9.5% & 12.0% & 11.3% & 11.4% & 11.4% & 11.1% \\ \hline Depreciation & 156.4 & 174.4 & 190.0 & 200.0 & 220.5 & 250.0 \\ \hline EBT & 436.6 & 761.2 & 863.2 & 1,022.4 & 1,123.5 & 1,134.5 \\ \hline EBT margin (%) & 7.0% & 9.8% & 9.2% & 9.5% & 9.5% & 9.1% \\ \hline Taxes & 1725 & 289.3 & 328.0 & 388.5 & 426.2 & 431.1 \\ \hline Net Income (NI) & 264.1 & 472.0 & 535.2 & 633.9 & 696.6 & 703.4 \\ \hline Retum on sales (\%) & 4.2% & 6.1% & 5.7% & 5.9% & 5.9% & 5.7% \\ \hline \begin{tabular}{l} Operating Cash Flows \\ (NI+ Depreciation ) \end{tabular} & 420.5 & 646.4 & 725.2 & 833.9 & 917.1 & 953.4 \\ \hline Change in NWC & (170,4) & (200.0) & (210.0) & (245.0) & (260.0) & (275,0) \\ \hline Change in CAPEX & 0 & (50.0) & (50.0) & (50.0) & (50,0) & (50.0) \\ \hline Free Casb Flow & 250.1 & 396.4 & 465.2 & 538.9 & 607.1 & 628.4 \\ \hline \end{tabular} \begin{tabular}{|c|c|c|c|c|} \hline \multicolumn{5}{|c|}{\begin{tabular}{l} Appendix 1. Saito Solar, Profit and Loss Statement \\ (millions of Yen, year ending June 30) \end{tabular}} \\ \hline Income Item & 2002 & 2010 & 2011 & 2012 \\ \hline Sales & 6,833.2 & 6,755.7 & 6.345 .1 & 6.234 .1 \\ \hline COGS & 4.323 .7 & $.208.1 & 1.1120 & 1.041 .2 \\ \hline Gross margin & 2,509.5 & 2,457.6 & 2,233.1 & 2,192,2 \\ \hline Gres margin (N) & 36.7% & 36.4% & 35.29 & 35.2% \\ \hline Marketing & selling & 1210.8 & 1.199 .6 & 1.083 .1 & 1,030.2 \\ \hline GicA expenses & 586.2 & 570.7 & 560.6 & 560.0 \\ \hline EBITDA & 7125 & 687.3 & 589.4 & 593.0 \\ \hline EBITDA margin (\%) & 10.4% & 10.2% & 9.3% & 9.5% \\ \hline Depreciation & 150.4 & 167.2 & 140.3 & 156.4 \\ \hline EBT & 5621 & 520.1 & 449.1 & 436.6 \\ \hline EBT margin (\%) & 8.2% & 7.7% & 7.1% & 7.0% \\ \hline Tans & 2220 & 205.4 & 177.4 & 172.5 \\ \hline Net lncome & 340.1 & 314.7 & 271.7 & 264.1 \\ \hline Rroum en salle (96) & 5.0% & 4.7% & 4.3% & 4.2% \\ \hline Dividendi & 150.0 & 150.0 & 150.0 & 150.0 \\ \hline Retained carnings & 190.1 & 164.7 & 121.7 & 114.1 \\ \hline \end{tabular} \begin{tabular}{|c|c|c|c|c|} \hline \multicolumn{5}{|c|}{\begin{tabular}{l} Appendix 2. Saito Solar, Balance Sheets \\ (millions of Yen, as of June 30) \end{tabular}} \\ \hline Asscts & 2002 & 2010 & 2011 & 2012 \\ \hline Cash & 120.3 & 833 & 40.6 & 140.7 \\ \hline Accounts Receivable & 1,828.0 & 1.895 .7 & 2.045 .0 & 2,121,3 \\ \hline Inventory & 1,127,7 & 1,100.8 & 1.010 .2 & 1,065.0 \\ \hline Prepaid Expenses & \begin{tabular}{r} 976 \\ \end{tabular} & \begin{tabular}{r} 90.1 \\ \end{tabular} & 89.2 & \begin{tabular}{r} 95.8 \\ - \end{tabular} \\ \hline Current Assets & 3.173 .6 & 3.169 .9 & 3,185,0 & 3,422.8 \\ \hline Net Fixed Asets & 2.210 .1 & 2.250 .2 & 2.246 .6 & 2.090 .2 \\ \hline Toul Asses & 5.383 .7 & 5.420 .1 & 5,431.6 & 5,513,0 \\ \hline Liabilities \& Net Worth & 2002 & 2010 & 2011 & 2012 \\ \hline Accounts Payable & 1.270 .6 & 1.098 .2 & 1,001.1 & 999.2 \\ \hline Accrued Expenses & 1430 & 187.1 & 1740 & 143.2 \\ \hline Current Liabilities & 1.413 .6 & 1,2853 & 1,175.1 & 1,142.4 \\ \hline Equity & 3.270 .1 & 2.134 .8 & 4.256 .5 & $.370.6 \\ \hline Liabilities of Net Warth & 5.383 .7 & 5.420 .1 & 5.831 .6 & 5.513 .0 \\ \hline \end{tabular} c) Mr. Saito wanted a completely independent determination of the value of the company. He selected your team to make reasonable assumptions based on the financial information provided to come up with a value not tainted by Mr. Suzuki's assumptions. You are to state your assumptions and reasoning behind them and determine a value based on those. Based on your analysis, would you say Mr. Suzuki's assumptions were reasonable? Please elaborate (15 points). Appendix 4. Discounting Future Cash Flows with Formulas A firm's free cash flows can be in a varicty of patterns, ranging from a simple single future cash flow to a complex mixed stream of projected cash flows. Most, if not all, can be handled by one of the formulas below. Generic DCF Formula PV=t=1n(1+r)tCFt - PV= the present value of the cash flow stream - CFt - the cash flow which occurs at the end of year t - r= the discount rate (assumed to be constant over the project horizon) * t - the year, which ranges from one to n * n = the last year in which a cash flow occurs - denotes summation of the cash flows as t goes from 1 to n 1 Note that discownt nate, opporranity nate, requirel nate of return, interest nate, cotpitalization nutz, and taeighted atvenage cost of caputal (WACC) are termes ued interchangeably by athors and practitioners. Fortunately, simpler versions (shortcurs) of the above formula exist, including: No Growth Perpetuity PV=rCFx where CF is the constant perpetual cash flow and r= the discount rate. Growing Perpetuity PV=rgCF1 where CF1 is the cash flow at the end of year one, f= the discount rate, and g= the growth rate. Regular Annuity PV=CF(r1r(1+r)T1) where CF represents the steady end-of-year cash flow, r= the discount rate, and T= the number of constant cash flows. The rerm in brackets is defined as an annuity factor, and facilitates more tedious algebraic computation. Growing Annuity PV=rgC1[1(1+r1+g)T2] where r= the discount rate, g = the growth rate, and T = the number of cash flows. Note that the formula above is simply the PV of a growing perpetuity "penalized" by cash flows foregone. In all of these cases, cash flows are assumed to occur at the end of the year, and the formulas throughour represent discrete (vs. continuous) time versions of these cash flows. Valuation of Saito Solar They were both very excitod about the solicitation and sanied so know how mach the offer was. Mr. Saito explained that the investment bank revealod sothing unles ounen of the firm agreed to opes up a conversation how much they would sell the company for: Mr. Yoshida's Valuation Mr. Yoshida was eppecially interested in the vile of the firm becaus he necled the cash to inver in hix roni new venture. He was a retired mechanical enginect who made some of his carlier fortues through a few lacrative real otate deals during the Japanese rcal ouare boom in the late 1990k. He had ence invesed in a few basinesses, all as a minority, silent partner, including Saine Solar. He thouphr thar Soine Solur should be worth aboer Y5 billion. His calculation was simple and seraighteforward. He arguod that the firm was generating about 250 million of net cast flows per year, and he believed these cah flows wete lakdy to onotinue for the noxt 20 years. He canse out with 5 billion by simply multiplying 250 million by 20 . Tbos5? 3 Mr. Suanki's Valuarion would be worth much less than 5 billion affer those cah floms ane disounsed. Hewever, he did not think cash the deraind for solar parsels, and that would increase the firmis net cah bows. He believed net cash flows should iscrease by 3.5% per year over the next 20 yran. He jar mocled to mule that calculution after he determined what to ase as a dincocint rate. Mr. Saitos Valuarion Mr. Saito was glad thar Mr. Suxuki undentood the discounted cant thow concept and its importance in viluation. He asteed that the firm would get some much-meoded als boons is the coming yean due to the new foed-is tariff that sarted in July. As the majotity ownet whe evenuw the diy-to-day operation of Saito Solas, he had witnessed an increase in salec onders since the acw sariff was puned. Unlike Me Sumbi, he didnit think the sales growth would be steady over the 20 -ycar period. He belicond alo grownt would be quite substantial in the first few yeas when consumes and busincoses fepponded to the change in the new tariff, but it would aper off. He alwo didn't believe that the firm wosld stop producing canh fioms after 20 yeas. He argued that the company would be in good hands, and hence should oas for the indefinie funure. He explained that mos companier a furmis cath flows to disappear after a certait period. In fact, Mr. Saito came to the meeting well prepured. Before the meering be asked his finance manager. Ms. Yamad, to prepare the 5-year calh flow propections shonon ia Eathibir 3, with the decails presented in Appendix 3. The projection had an aggressive ales grown is the near furure, with growth slowing in laner year. Ms. Yamads, whe had since joined the meeting, also sugeoned thar cash flows beyood the 5-yeaf period should be growing at a constant rate of 1-3\%. After mome dacifications and discuanions, the partnen were convincod
Step by Step Solution
There are 3 Steps involved in it

Get step-by-step solutions from verified subject matter experts