

Question: NOTE: For questions 3 and 4 you will display variables using 132 rows of observations (11 years*12 months =132 observations.) Column AB has the month
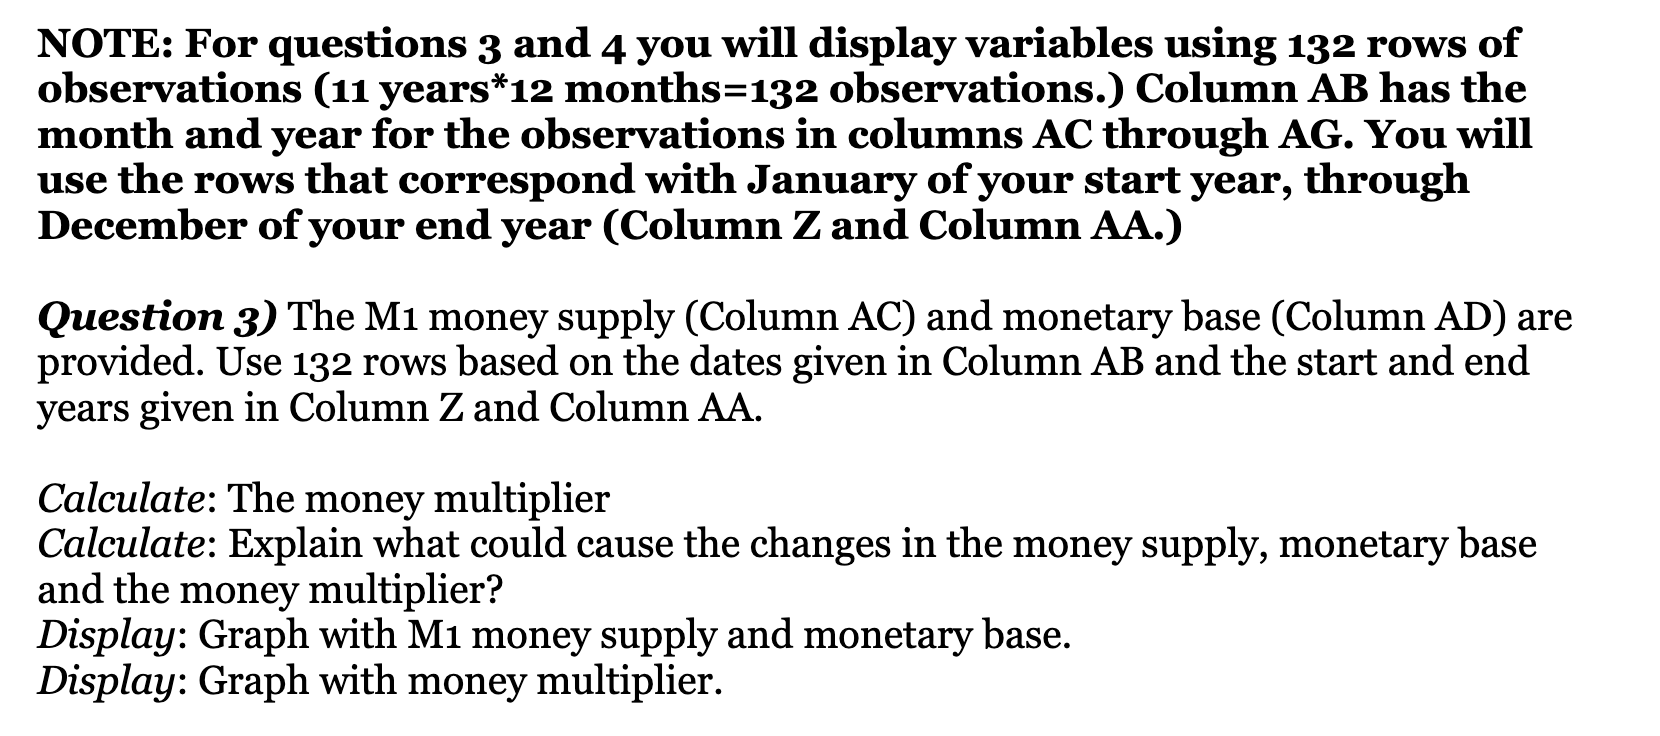


NOTE: For questions 3 and 4 you will display variables using 132 rows of observations (11 years*12 months =132 observations.) Column AB has the month and year for the observations in columns AC through AG. You will use the rows that correspond with January of your start year, through December of your end year (Column Z and Column AA.) Question 3) The M1 money supply (Column AC) and monetary base (Column AD) are provided. Use 132 rows based on the dates given in Column AB and the start and end years given in Column Z and Column AA. Calculate: The money multiplier Calculate: Explain what could cause the changes in the money supply, monetary base and the money multiplier? Display: Graph with M1 money supply and monetary base. Display: Graph with money multiplier. NOTE: For questions 3 and 4 you will display variables using 132 rows of observations (11 years*12 months =132 observations.) Column AB has the month and year for the observations in columns AC through AG. You will use the rows that correspond with January of your start year, through December of your end year (Column Z and Column AA.) Question 3) The M1 money supply (Column AC) and monetary base (Column AD) are provided. Use 132 rows based on the dates given in Column AB and the start and end years given in Column Z and Column AA. Calculate: The money multiplier Calculate: Explain what could cause the changes in the money supply, monetary base and the money multiplier? Display: Graph with M1 money supply and monetary base. Display: Graph with money multiplier
Step by Step Solution
There are 3 Steps involved in it

Get step-by-step solutions from verified subject matter experts