

Question: NOTE: I NEED the answer for 2,3,4,5 please do them its part of an one assignment . and please do level them so i know
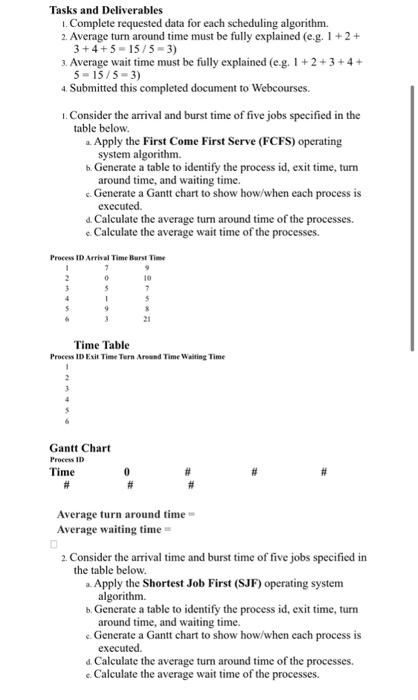
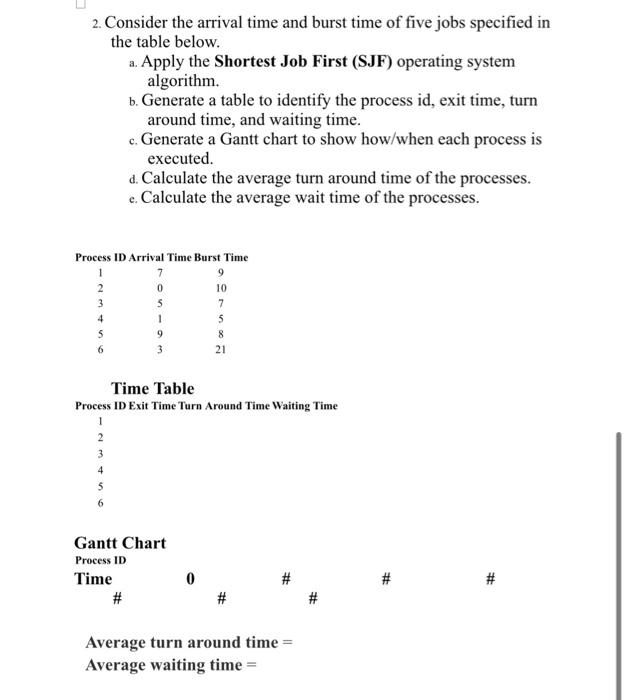
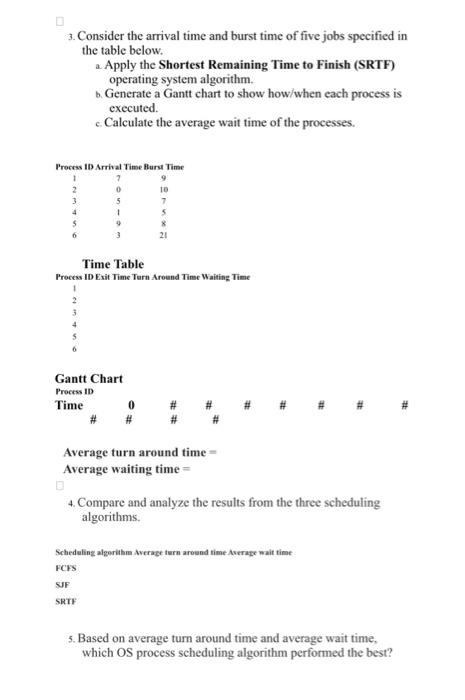
Tasks and Deliverables 1. Complete requested data for each scheduling algorithm. 2. Average turn around time must be fully explained (e.g. 1+2+ 3+4+5=15/5=3 ) 3. Average wait time must be fully explained (e.g. 1+2+3+4+ 5=15/5=3 ) 4. Submitted this completed document to Webcourses. 1. Consider the arrival and burst time of five jobs specified in the table below. a. Apply the First Come First Serve (FCFS) operating system algorithm. b. Generate a table to identify the process id, exit time, turn around time, and waiting time. c. Generate a Gantt chart to show how/when each process is executed. 4. Calculate the average turn around time of the processes. c. Calculate the average wait time of the processes. Time Table Proces 1D E.xit Time Tern Areand Time Waiting Tme Average turn around time = Average waiting time = 2. Consider the arrival time and burst time of five jobs specified in the table below. a. Apply the Shortest Job First (SJF) operating system algorithm. b. Generate a table to identify the process id, exit time, turn around time, and waiting time. c. Generate a Gantt chart to show how/when cach process is executed. 4. Calculate the average tum around time of the processes. c. Calculate the average wait time of the processes. 2. Consider the arrival time and burst time of five jobs specified in the table below. a. Apply the Shortest Job First (SJF) operating system algorithm. b. Generate a table to identify the process id, exit time, turn around time, and waiting time. c. Generate a Gantt chart to show how/when each process is executed. d. Calculate the average turn around time of the processes. e. Calculate the average wait time of the processes. 3. Consider the arrival time and burst time of five jobs specified in the table below. a. Apply the Shortest Remaining Time to Finish (SRTF) operating system algorithm. b. Generate a Gantt chart to show how/when each process is executed. c. Calculate the average wait time of the processes. Time Table Process ID Exit Time Tarn Around Time Waiting Time Gantt Chart Process ID Average turn around time = Average waiting time = 4. Compare and analyze the results from the three scheduling algorithms. Schedwhing algerithm Average turn areund time Average wait time FCFS SJ SRTF 5. Based on average turn around time and average wait time, which OS process scheduling algorithm performed the best
Step by Step Solution
There are 3 Steps involved in it

Get step-by-step solutions from verified subject matter experts