

Question: Note: Line segments will automatically connect the points. Remember to plot from left to right. 6 A 5 Tim's Demand 4 Alyssa's Demand 3 PRICE
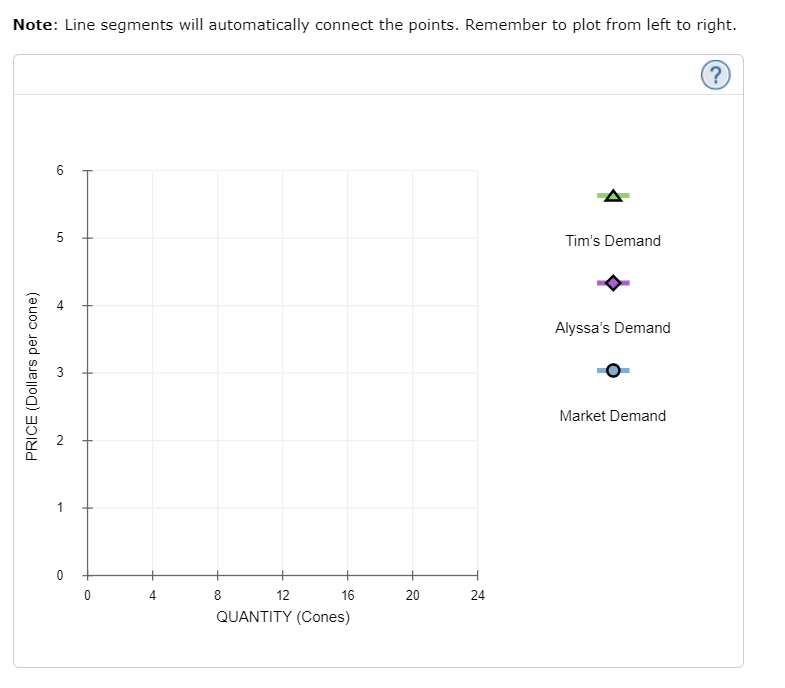
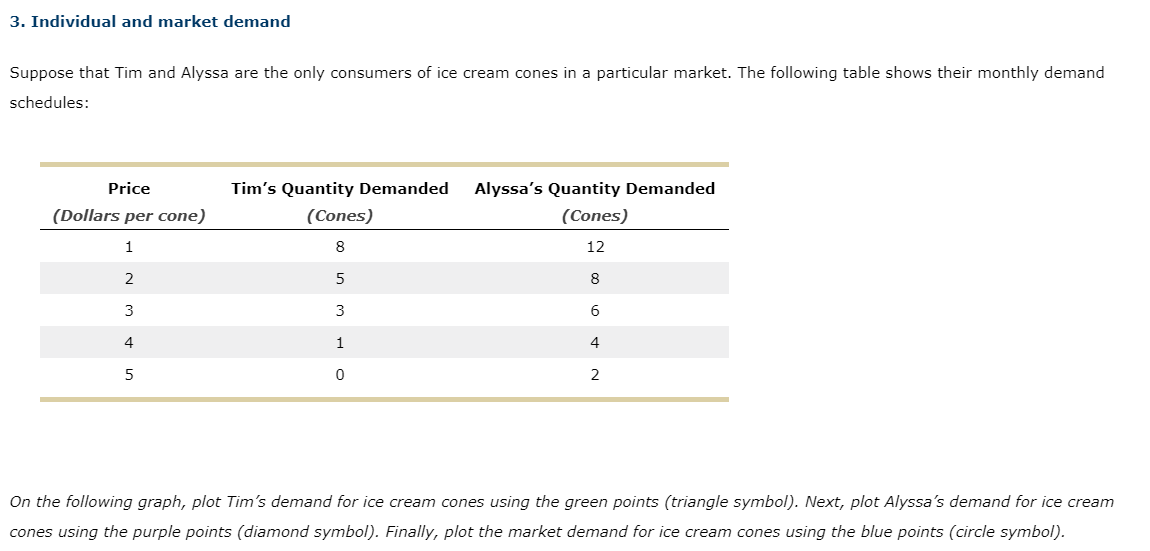
Note: Line segments will automatically connect the points. Remember to plot from left to right. 6 A 5 Tim's Demand 4 Alyssa's Demand 3 PRICE (Dollars per cone) Market Demand 2 1 0 A 8 12 16 20 24 QUANTITY (Cones)3. Individual and market demand Suppose that Tim and Alyssa are the only consumers of ice cream cones in a particular market. The following table shows their monthly demand schedules: Price Tim's Quantity Demanded Alyssa's Quantity Demanded ( Dollars per cone) (Cones) (Cones) 1 8 12 2 5 8 3 3 6 4 1 4 5 0 2 On the following graph, plot Tim's demand for ice cream cones using the green points ( triangle symbol). Next, plot Alyssa's demand for ice cream cones using the purple points (diamond symbol). Finally, plot the market demand for ice cream cones using the blue points { circle symbol)
Step by Step Solution
There are 3 Steps involved in it

Get step-by-step solutions from verified subject matter experts