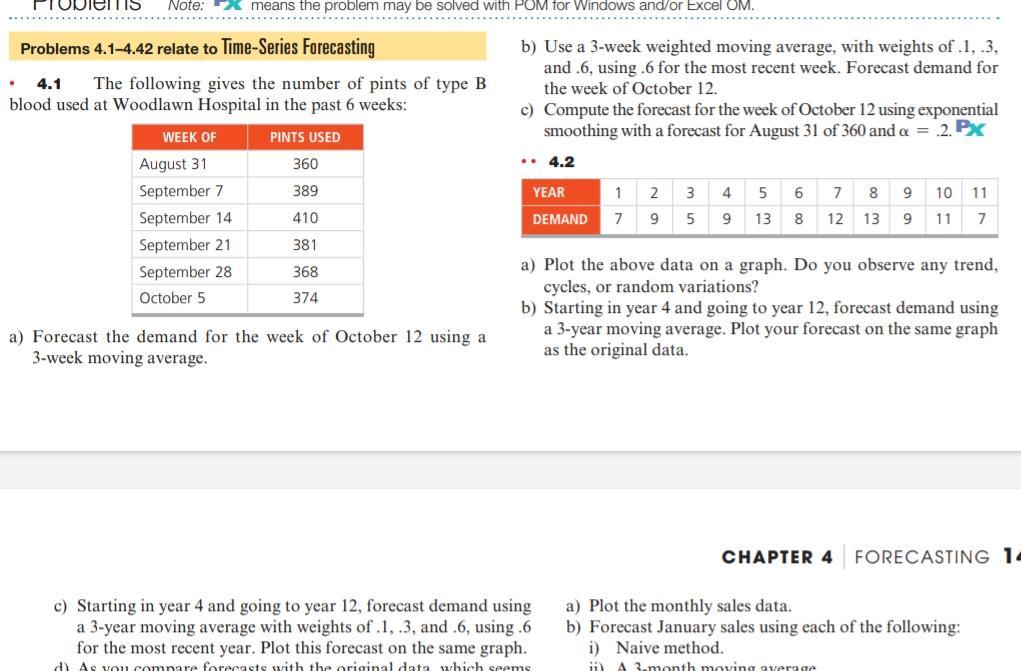
Question: Note: means the problem may be solved with POM for Windows and/or Excel OM. . b) Use a 3-week weighted moving average, with weights of

Note: means the problem may be solved with POM

Note: means the problem may be solved with POM for Windows and/or Excel OM. . b) Use a 3-week weighted moving average, with weights of .1,.3, and .6, using .6 for the most recent week. Forecast demand for the week of October 12. c) Compute the forecast for the week of October 12 using exponential smoothing with a forecast for August 31 of 360 and a = 2. PX .. 4.2 Problems 4.1-4.42 relate to Time-Series Forecasting 4.1 The following gives the number of pints of type B blood used at Woodlawn Hospital in the past 6 weeks: WEEK OF PINTS USED August 31 360 September 7 389 September 14 410 September 21 381 September 28 368 October 5 374 2 3 4 5 7 8 9 YEAR DEMAND 1 7 6 8 10 11 11 7 9 9 12 13 9 a) Plot the above data on a graph. Do you observe any trend, cycles, or random variations? b) Starting in year 4 and going to year 12, forecast demand using a 3-year moving average. Plot your forecast on the same graph as the original data. a) Forecast the demand for the week of October 12 using a 3-week moving average. CHAPTER 4 FORECASTING 1 c) Starting in year 4 and going to year 12, forecast demand using a 3-year moving average with weights of .1,.3, and .6, using.6 for the most recent year. Plot this forecast on the same graph. a) Plot the monthly sales data. b) Forecast January sales using each of the following: i) Naive method. ii) A 3.month moving averase d) As you compare forecasts with the original data which seems

Step by Step Solution

There are 3 Steps involved in it

1 Expert Approved Answer
Step: 1 Unlock blur-text-image
Question Has Been Solved by an Expert!

Get step-by-step solutions from verified subject matter experts

Step: 2 Unlock
Step: 3 Unlock

Students Have Also Explored These Related General Management Questions!