

Question: Note need only questions # 6,7,8 Note need only questions # 6,7,8 ABC Corporation is monitoring the output of metal parts produced in its new
Note need only questions # 6,7,8
Note need only questions # 6,7,8
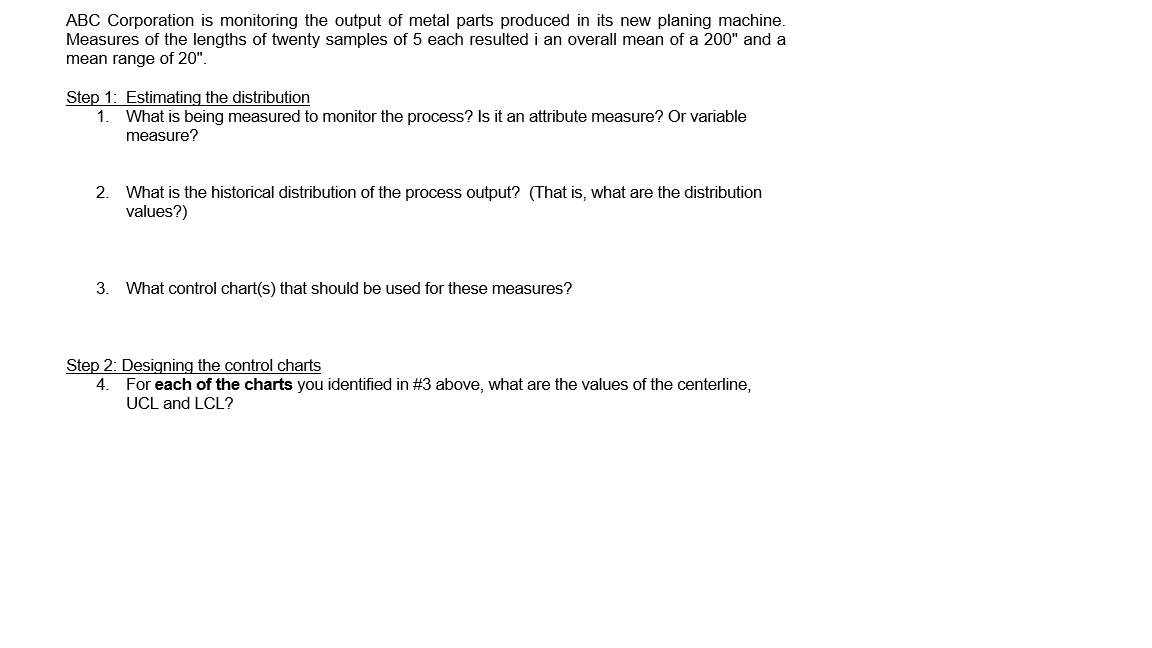
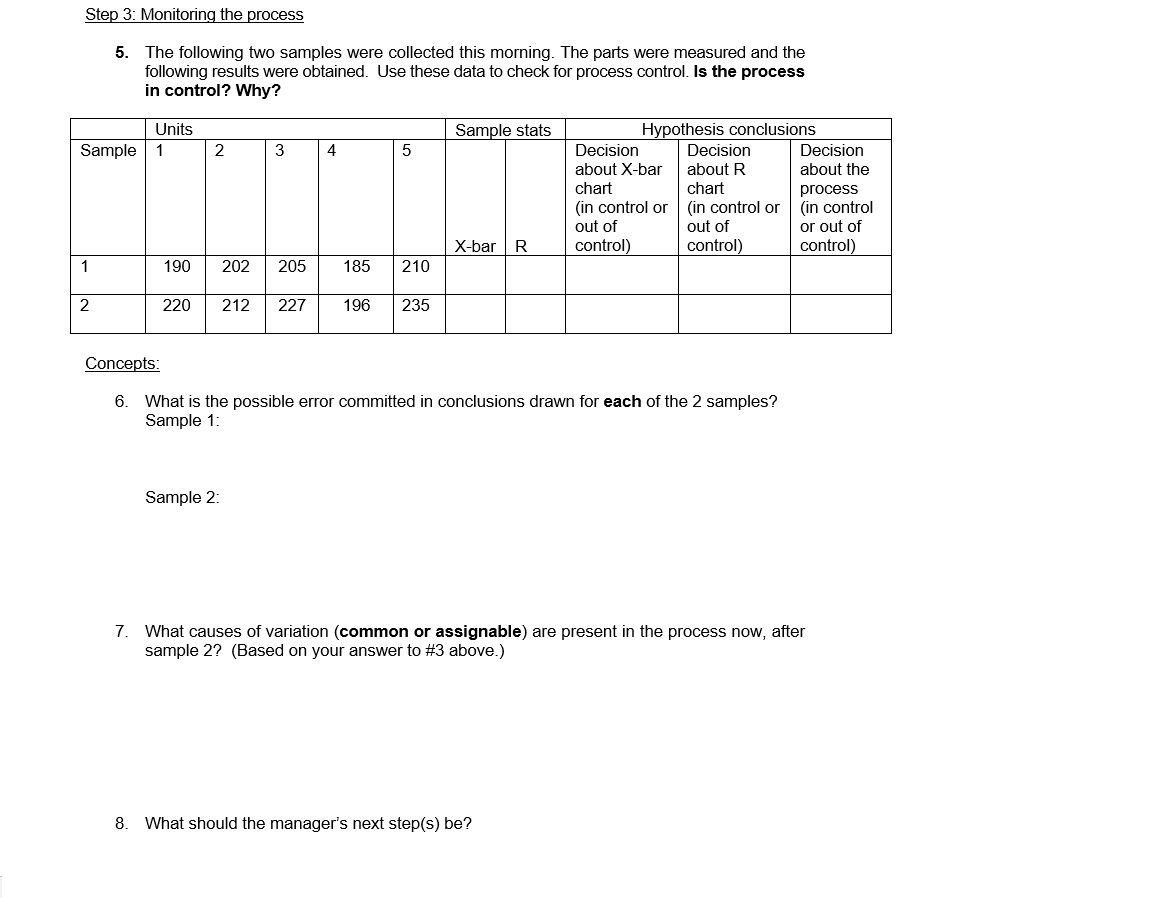
ABC Corporation is monitoring the output of metal parts produced in its new planing machine. Measures of the lengths of twenty samples of 5 each resulted i an overall mean of a 200" and a mean range of 20". Step 1: Estimating the distribution 1. What is being measured to monitor the process? Is it an attribute measure? Or variable measure? 2. What is the historical distribution of the process output? (That is, what are the distribution values?) 3 What control chart(s) that should be used for these measures? Step 2: Designing the control charts 4. For each of the charts you identified in #3 above, what are the values of the centerline, UCL and LCL? Step 3: Monitoring the process 5. The following two samples were collected this morning. The parts were measured and the following results were obtained. Use these data to check for process control. Is the process in control? Why? Units Sample stats Sample 1 2 3 4 5 Hypothesis conclusions Decision Decision Decision about X-bar about R about the chart chart process (in control or (in control or in control out of out of or out of control) control) control) X-bar R 1 190 202 205 185 210 2 220 212 227 196 235 Concepts: 6. What is the possible error committed in conclusions drawn for each of the 2 samples? Sample 1: Sample 2: 7. What causes of variation (common or assignable) are present in the process now, after sample 2? (Based on your answer to #3 above.) 8. What should the manager's next step(s) beStep by Step Solution
There are 3 Steps involved in it
1 Expert Approved Answer
Step: 1 Unlock

Question Has Been Solved by an Expert!
Get step-by-step solutions from verified subject matter experts
Step: 2 Unlock
Step: 3 Unlock