

Question: Note: Once you enter a value in a white field, the graph and any corresponding amounts in each grey field will change accordingly. Graph Input
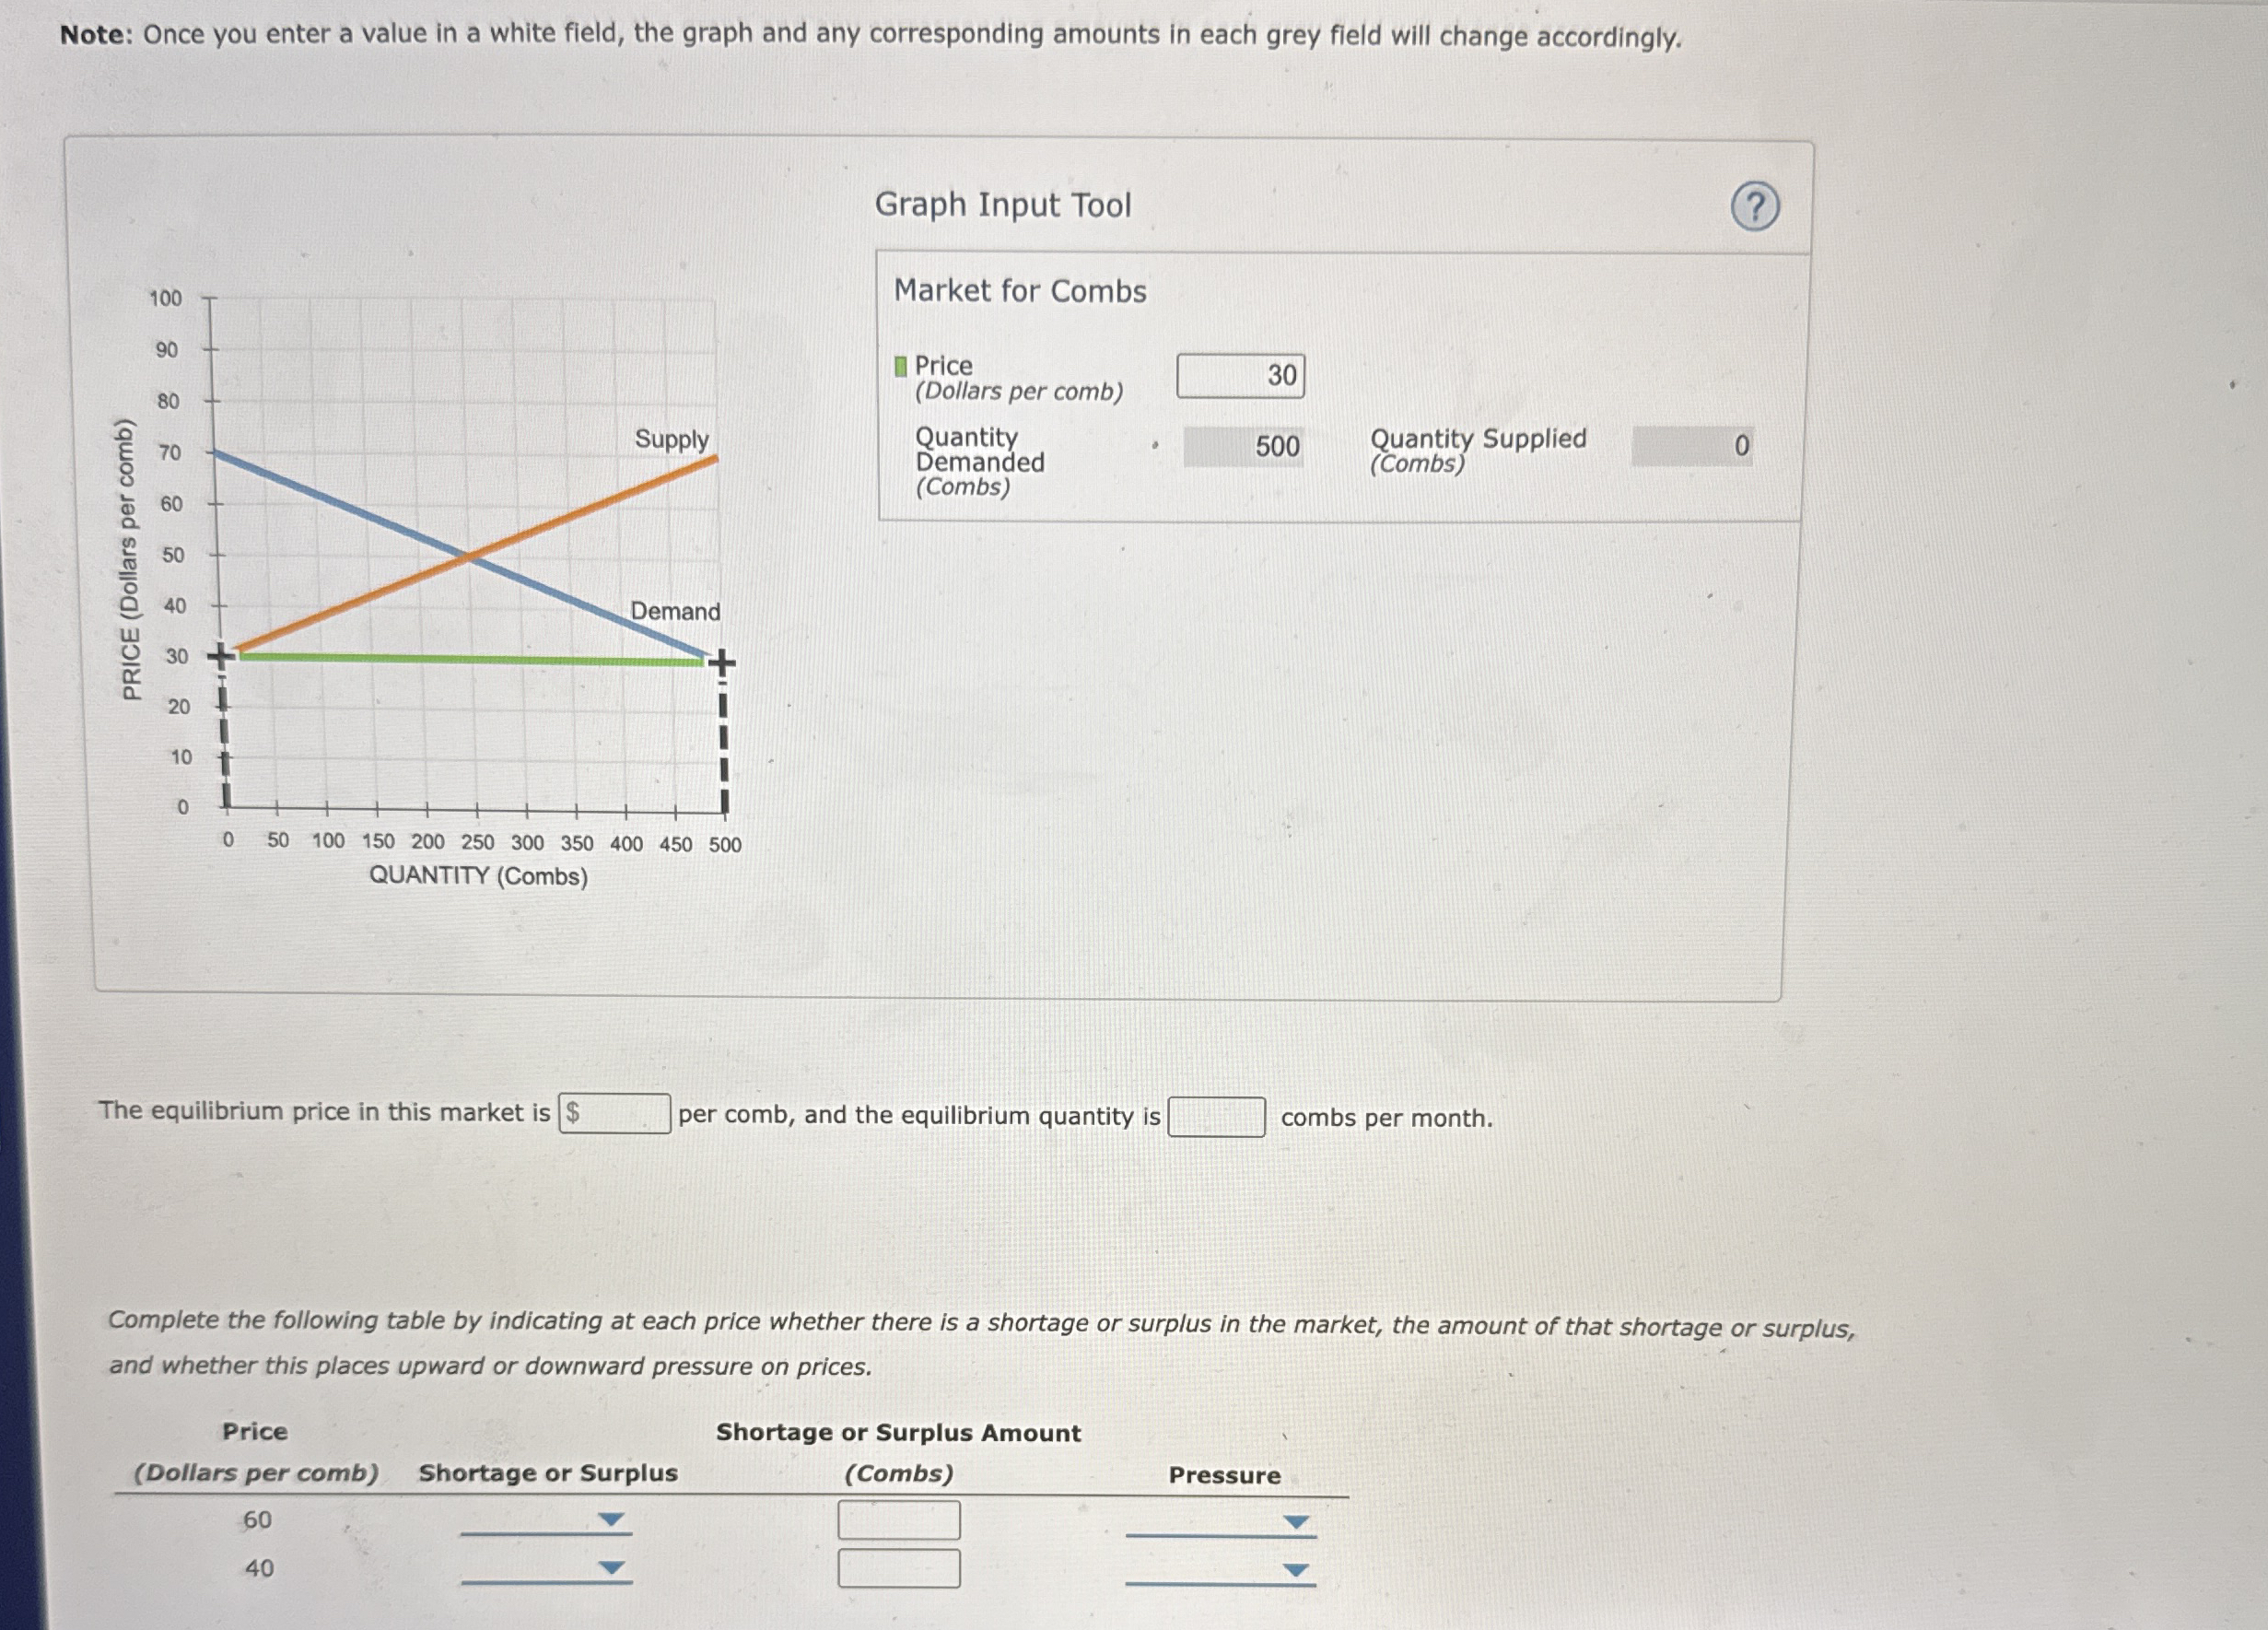
Note: Once you enter a value in a white field, the graph and any corresponding amounts in each grey field will change accordingly.
Graph Input Tool
Market for Combs
Price
Dollars per comb
Quantity
Demanded
Combs
Quantity Supplied Combs
The equilibrium price in this market is per comb, and the equilibrium quantity is combs per month.
Complete the following table by indicating at each price whether there is a shortage or surplus in the market, the amount of that shortage or surplus, and whether this places upward or downward pressure on prices.
tabletablePriceDollars per combShortage or Surplus,tableShortage or Surplus AmountCombs
Step by Step Solution
There are 3 Steps involved in it
1 Expert Approved Answer
Step: 1 Unlock

Question Has Been Solved by an Expert!
Get step-by-step solutions from verified subject matter experts
Step: 2 Unlock
Step: 3 Unlock