

Question: Note: Once you enter a value in a white field, the graph and any corresponding amounts in each grey field will change accordingly. Graph Input

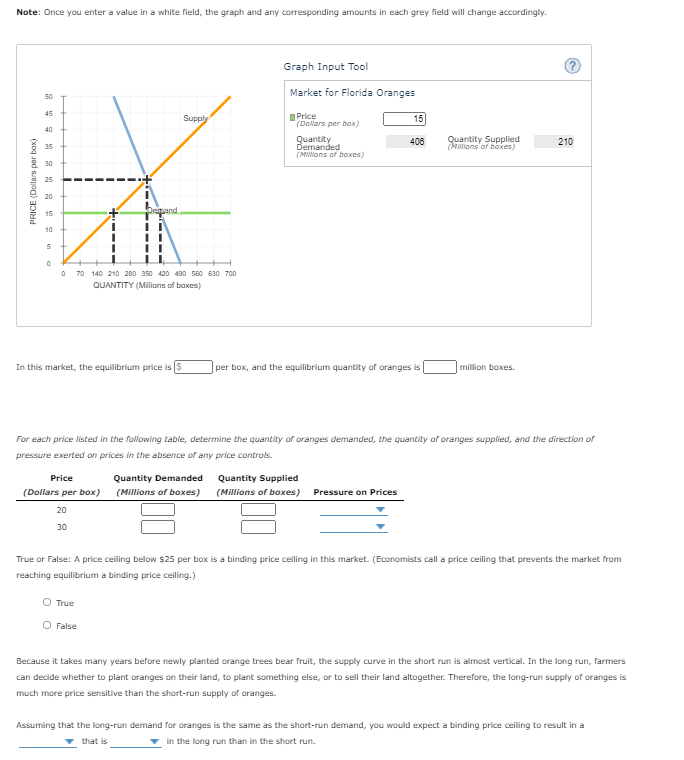
Note: Once you enter a value in a white field, the graph and any corresponding amounts in each grey field will change accordingly. Graph Input Tool Market for Florida Oranges Supply Price (Dollars per box) 15 Quantity 408 Quantity Supplied Demanded (Millions of boxes) 210 (ions of boxes) PRICE (Dollars per bax) D 140 210 280 350 420 490 560 630 700 QUANTITY (Millions of boxes) In this market, the equilibrium price is |$ per box, and the equilibrium quantity of oranges is| |million boxes. For each price listed in the following table, determine the quantity of oranges demanded, the quantity of oranges supplied, and the direction of pressure exerted on prices in the absence of any price controls. Price Quantity Demanded Quantity Supplied (Dollars per box) (Millions of boxes) (Millions of boxes) Pressure on Prices 20 310 True or False: A price ceiling below $25 per box is a binding price ceiling in this market. (Economists call a price ceiling that prevents the market from reaching equilibrium a binding price ceiling.) O True O False Because it takes many years before newly planted orange trees bear fruit, the supply curve in the short run is almost vertical. In the long run, farmers can decide whether to plant oranges on their land, to plant something else, or to sell their land altogether. Therefore, the long-run supply of oranges is much more price sensitive than the short-run supply of oranges. Assuming that the long-run demand for oranges is the same as the short-run demand, you would expect a binding price ceiling to result in a that is in the long run than in the short run
Step by Step Solution
There are 3 Steps involved in it

Get step-by-step solutions from verified subject matter experts