

Question: NOTE : Pare 1 has already been completed and noted in the red text below. Need assistance w/ Part 2. This problem focuses on a
NOTE: Pare 1 has already been completed and noted in the red text below. Need assistance w/Part 2.
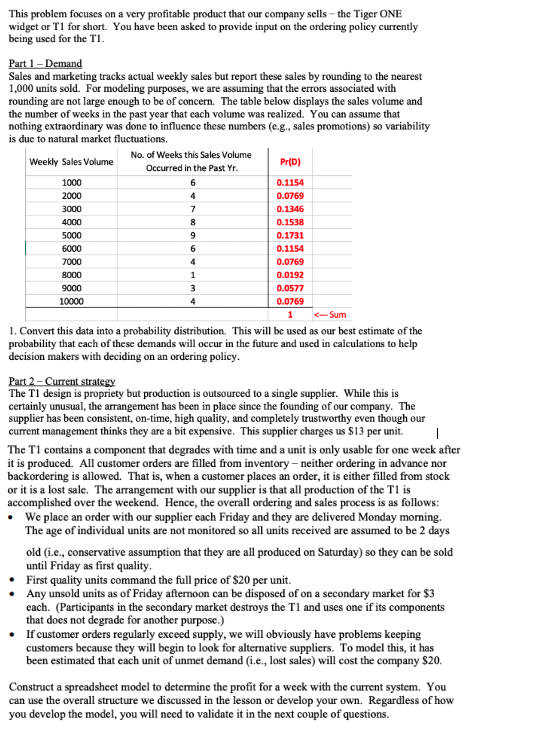
This problem focuses on a very profitable product that our company sells - the Tiger ONE widget or Ti for short. You have been asked to provide input on the ordering policy currently being used for the Ti. Part 1 - Demand Sales and marketing tracks actual weekly sales but report these sales by rounding to the nearest 1,000 units sold. For modeling purposes, we are assuming that the errors associated with rounding are not large enough to be of concern. The table below displays the sales volume and the number of weeks in the past year that each volume was realized. You can assume that nothing extraordinary was done to influence these numbers (e.g., sales promotions) so variability is due to natural market fluctuations. Weekly Sales Volume No. of Weeks this Sales Volume Occurred in the Past Yr. Pr(D) 6 4 7 8 9 1000 2000 3000 4000 5000 6000 7000 8000 9000 10000 0.1154 0.0769 0.1346 0.1538 0.1731 0.1154 0.0769 0.0192 0.0577 0.0769 6 4 1 3 4
Step by Step Solution
There are 3 Steps involved in it

Get step-by-step solutions from verified subject matter experts