

Question: ( Note; please check picture attached to question for data ) a . Plot the above data on a graph. Do you observe any trend,
Note; please check picture attached to question for data
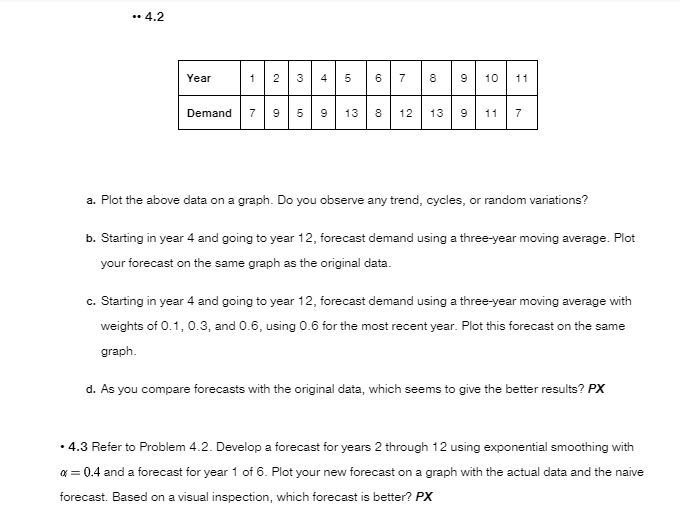
a Plot the above data on a graph. Do you observe any trend, cycles, or random variations?
b Starting in year and going to year forecast demand using a threeyear moving average. Plot
your forecast on the same graph as the original data.
c Starting in year and going to year forecast demand using a threeyear moving average with
weights of and using for the most recent year. Plot this forecast on the same
graph.
d As you compare forecasts with the original data, which seems to give the better results?
Refer to Problem Develop a forecast for years through using exponential smoothing with
and a forecast for year of Plot your new forecast on a graph with the actual data and the naive
forecast. Based on a visual inspection, which forecast is better?
Step by Step Solution
There are 3 Steps involved in it
1 Expert Approved Answer
Step: 1 Unlock

Question Has Been Solved by an Expert!
Get step-by-step solutions from verified subject matter experts
Step: 2 Unlock
Step: 3 Unlock