

Question: Note: Please circle your answers when appropriate! 1) You measure the height of 10 male and 13 female hippopotamuses and get the following results. [5
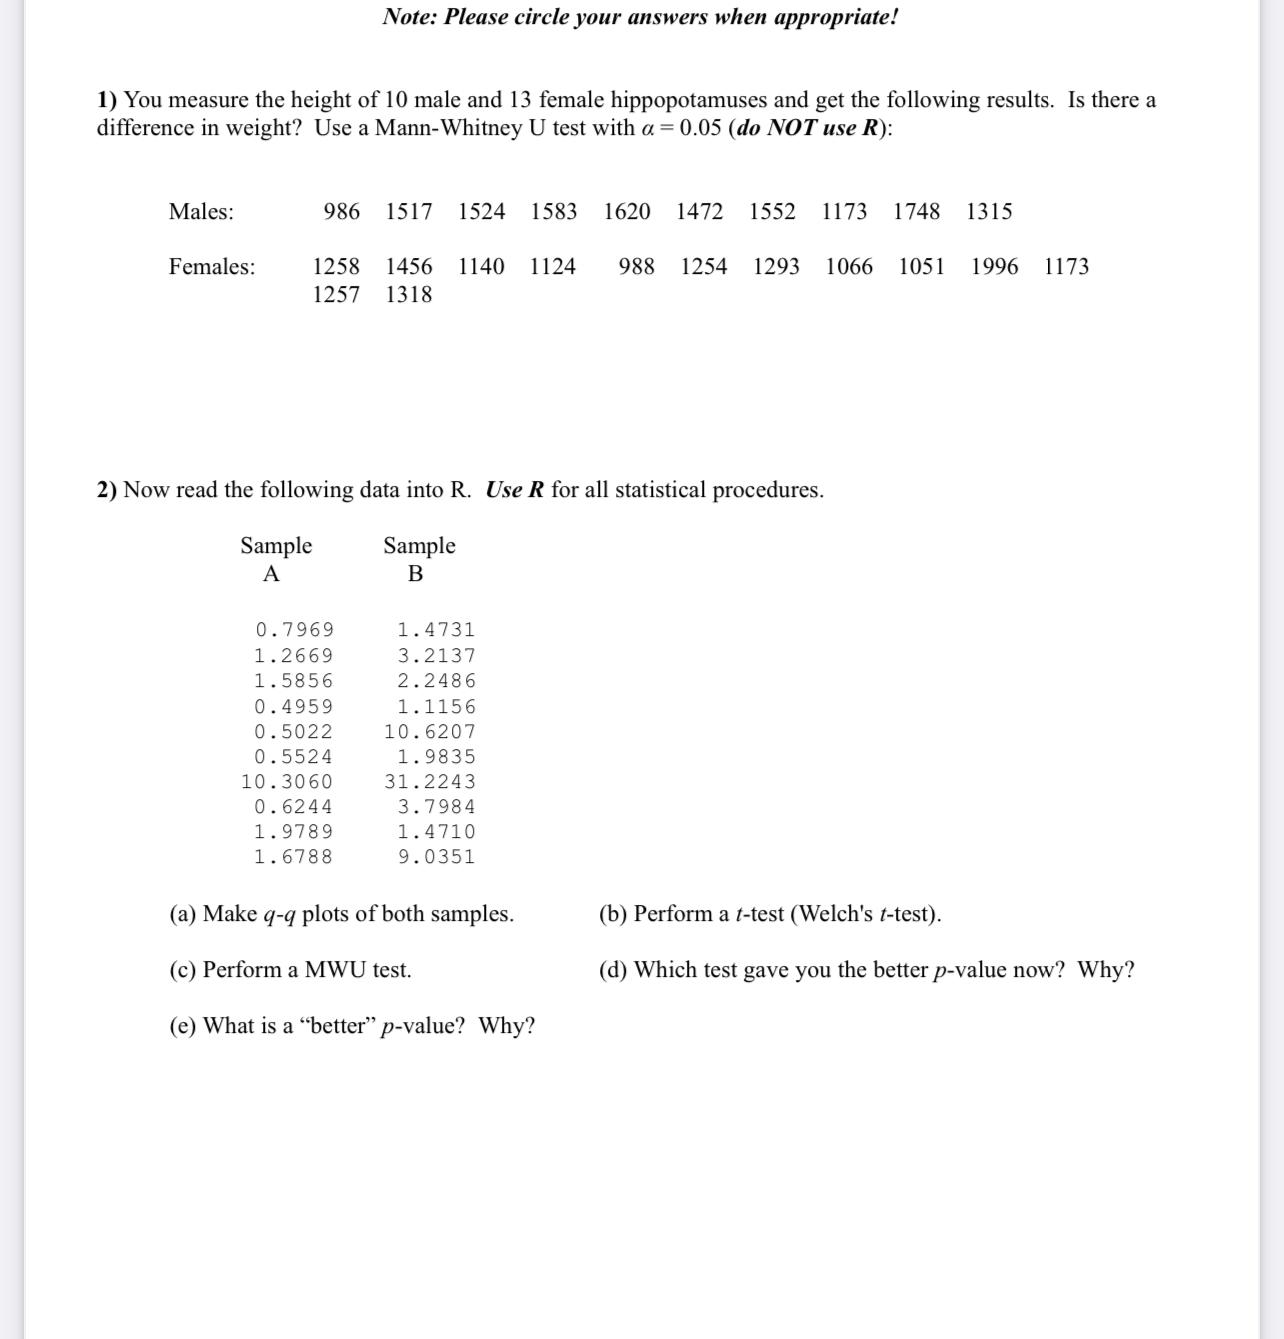
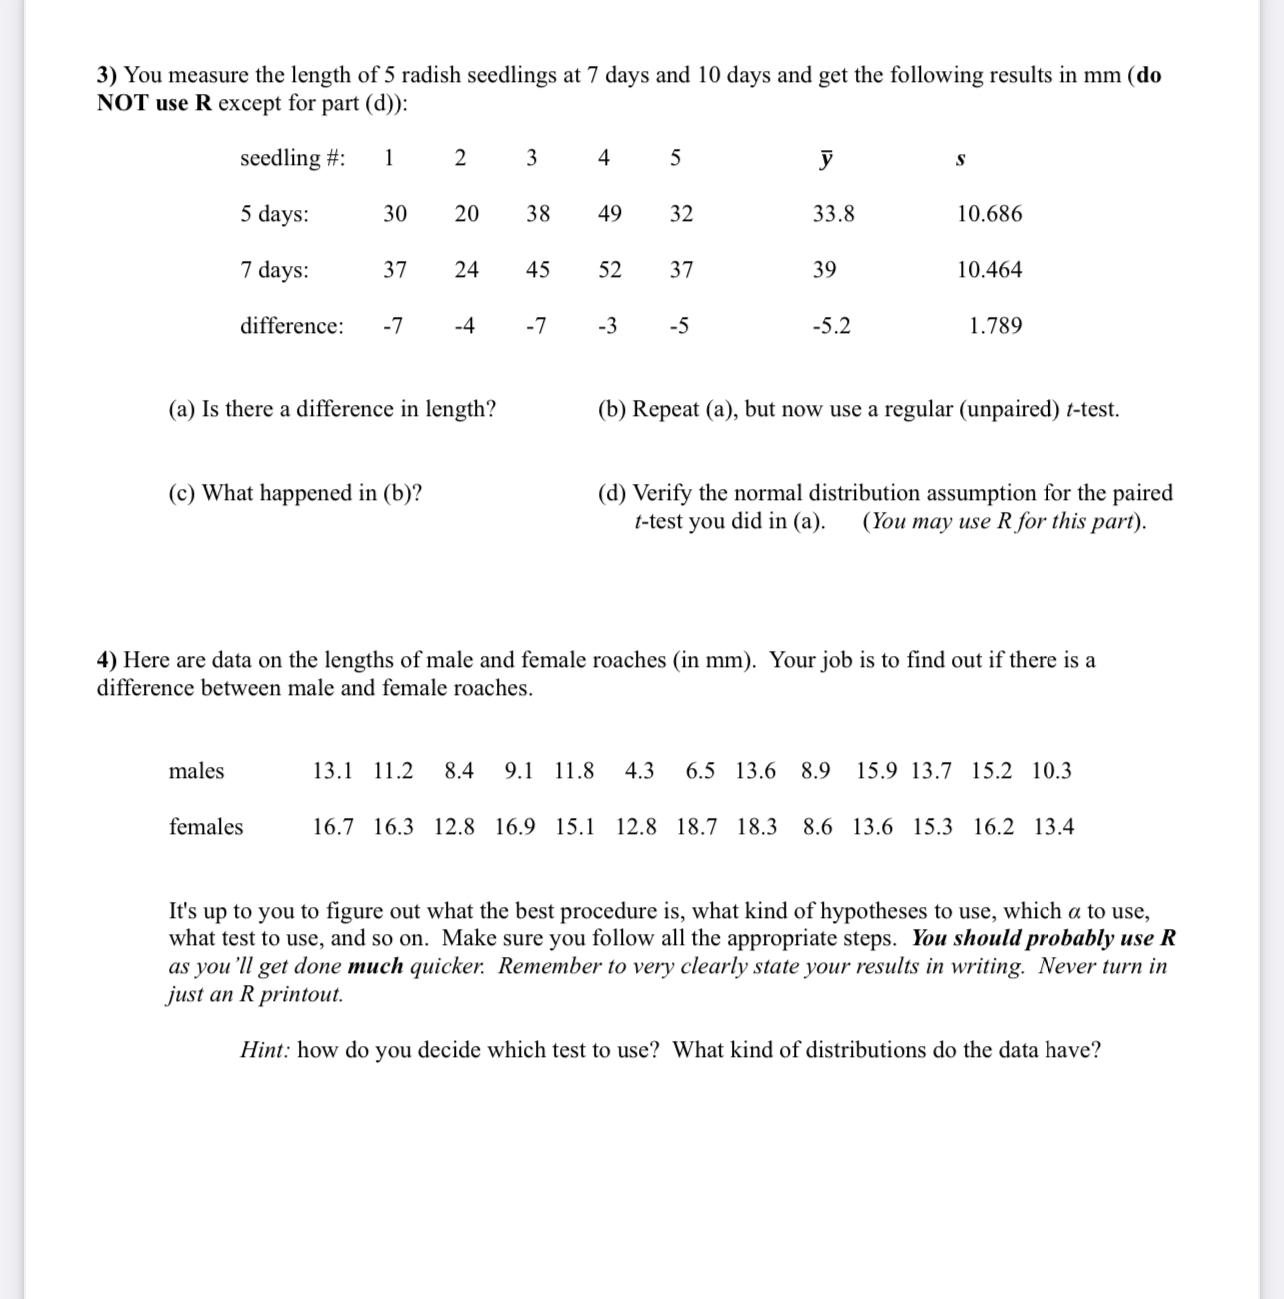
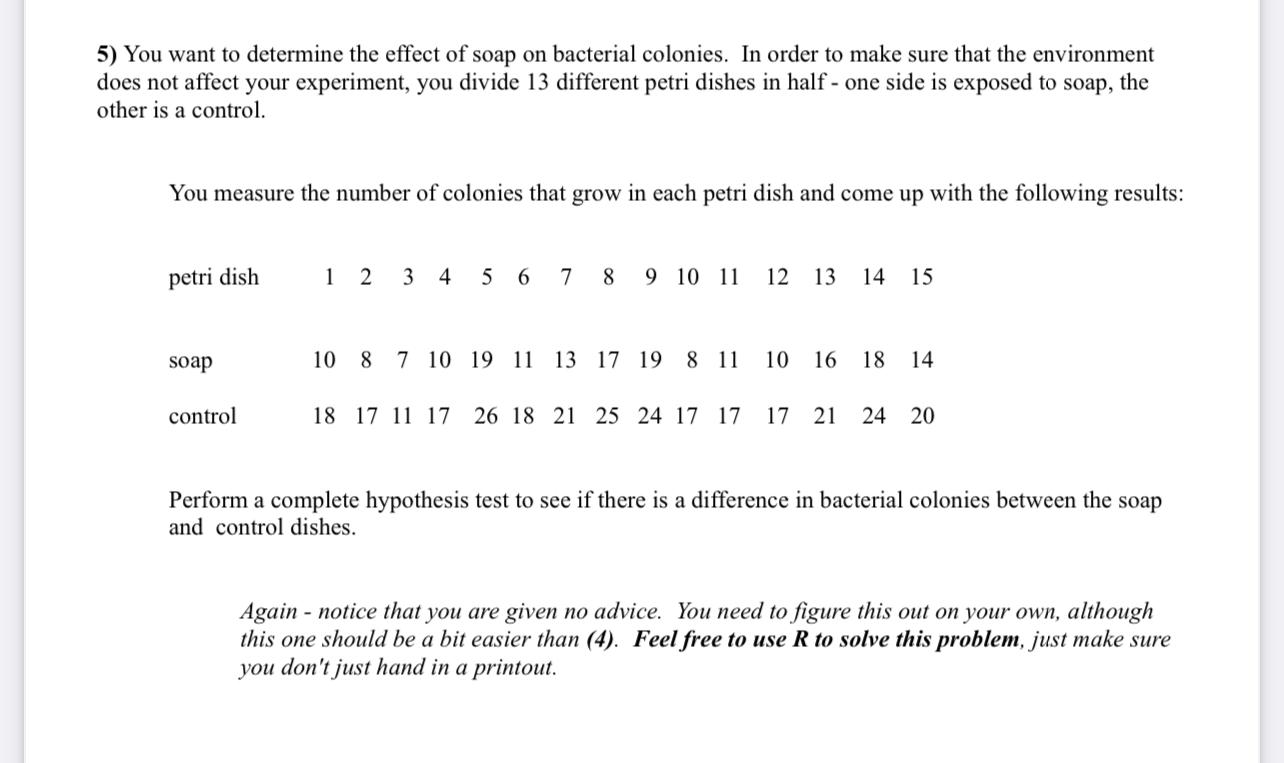
Note: Please circle your answers when appropriate! 1) You measure the height of 10 male and 13 female hippopotamuses and get the following results. [5 there a difference in weight? Use a Mann-Whitney U test with o = 0.05 (do NOT use R): Males: 986 1517 1524 1583 1620 1472 1552 1173 1748 1315 Females: 1258 1456 1140 1124 988 1254 1293 1066 1051 1996 1173 1257' 1318 2) Now read the following data into R. Use R for all statistical procedures. Sample Sample A B 0.7969 1.4731 1.2669 3.2137 1.5856 2.2486 0.4959 1.1156 0.5022 10.6207 0.5524 1.9835 10.3060 31.2243 0.6244 3.7984 1.9789 1.4710 1.6788 9.0351 (a) Make q-q plots of both samples. (b) Perform a t-test (Welch's t-test). (c) Perform a MWU test. (d) Which test gave you the better pvalue now? Why? (6) What is a \"better" p-value? Why? 3) You measure the length of 5 radish seedlings at 7 days and 10 days and get the following results in mm (do NOT use R except for part (d)): seedling #: 1 2 3 4 5 5 days: 30 20 38 49 32 33.8 10.686 7 days: 37 24 45 52 37 39 10.464 difference: -7 -4 -7 -3 -5 5.2 1.789 (a) Is there a difference in length? (b) Repeat (a), but now use a regular (unpaired) t-test. (c) What happened in (b)? (d) Verify the normal distribution assumption for the paired t-test you did in (a). (You may use R for this part). 4) Here are data on the lengths of male and female roaches (in mm). Your job is to find out if there is a difference between male and female roaches. males 13.1 11.2 8.4 9.1 11.8 8 4.3 6.5 13.6 8.9 15.9 13.7 15.2 10.3 females 16.7 16.3 12.8 16.9 15.1 12.8 18.7 18.3 8.6 13.6 15.3 16.2 13.4 It's up to you to figure out what the best procedure is, what kind of hypotheses to use, which a to use, what test to use, and so on. Make sure you follow all the appropriate steps. You should probably use R as you'll get done much quicker. Remember to very clearly state your results in writing. Never turn in just an R printout. Hint: how do you decide which test to use? What kind of distributions do the data have?5) You want to determine the effect of soap on bacterial colonies. In order to make sure that the environment does not affect your experiment, you divide 13 different petri dishes in half - one side is exposed to soap, the other is a control. You measure the number of colonies that grow in each petri dish and come up with the following results: petri dish 1 2 3 4 5 6 7 8 9 10 11 12 13 14 15 soap 10 8 7 10 19 11 13 17 19 8 11 10 16 18 14 control 18 17 11 17 26 18 21 25 24 17 17 17 21 24 20 Perform a complete hypothesis test to see if there is a difference in bacterial colonies between the soap and control dishes. Again - notice that you are given no advice. You need to figure this out on your own, although this one should be a bit easier than (4). Feel free to use R to solve this problem, just make sure you don't just hand in a printout
Step by Step Solution
There are 3 Steps involved in it

Get step-by-step solutions from verified subject matter experts