

Question: Note: Please use the same data and fill the empty places in tables . . Note: Please use the same data and fill the empty
Note: Please use the same data and fill the empty places in tables
.
.
Note: Please use the same data and fill the empty places in tables
.Please Please fill the empty places in table no need formula
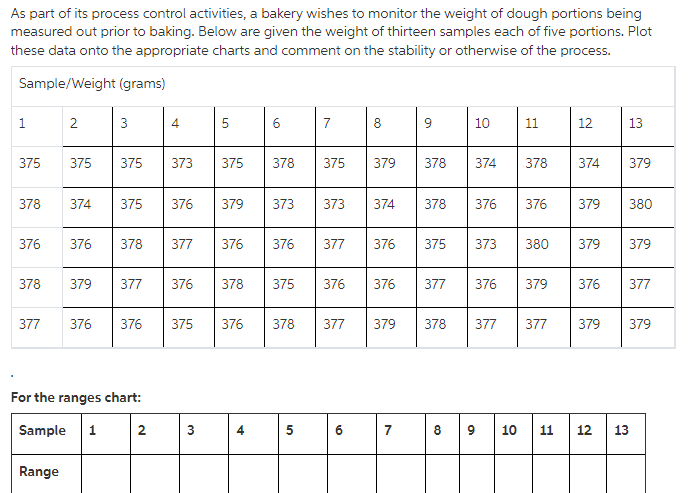
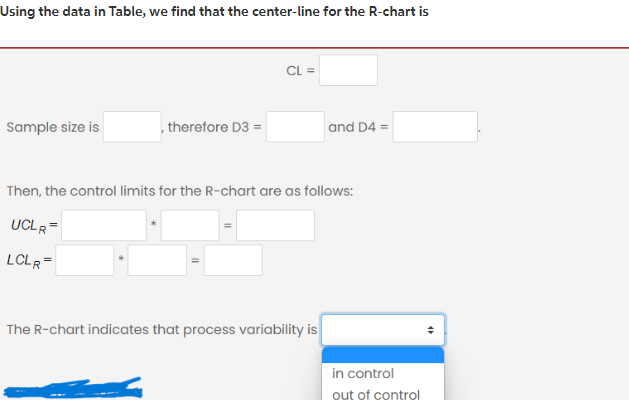
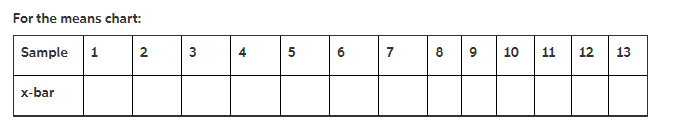
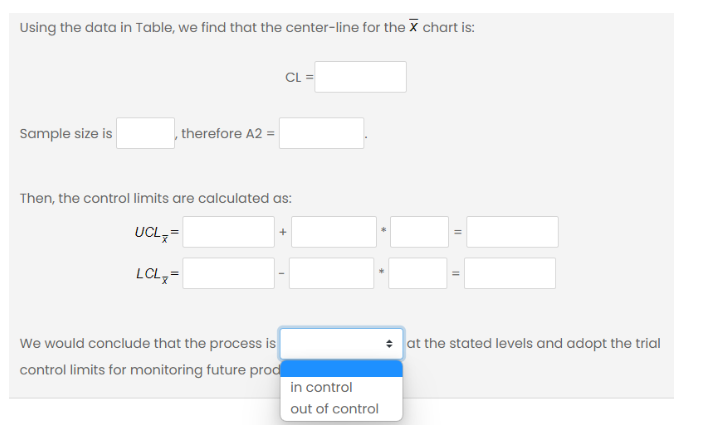
As part of its process control activities, a bakery wishes to monitor the weight of dough portions being measured out prior to baking. Below are given the weight of thirteen samples each of five portions. Plot these data onto the appropriate charts and comment on the stability or otherwise of the process. Sample/Weight (grams) 1 2 3 4 5 6 7 8 9 10 11 12 13 375 375 375 373 375 378 375 379 378 374 378 374 379 378 374 375 376 379 373 373 374 378 376 376 379 380 376 376 378 377 376 376 377 376 375 373 380 379 379 378 379 377 376 378 375 376 376 377 376 379 376 377 377 376 376 375 376 378 377 379 378 377 377 379 379 For the ranges chart: Sample 1 2 3 7 12 Range 10 10 8 9 10 Using the data in Table, we find that the center-line for the R-chart is CL = Sample size is therefore D3 = and D4 = Then, the control limits for the R-chart are as follows: UCL R = LCL R= The R-chart indicates that process variability is in control out of control 4 For the means chart: Sample 1 2 x-bar 3 + 5 6 7 8 9 10 11 12 13 Using the data in Table, we find that the center-line for the X chart is: CL = Sample size is , therefore A2 = Then, the control limits are calculated as: UCL == LCL = We would conclude that the process is control limits for monitoring future prod in control out of control 11 + at the stated levels and adopt the trialStep by Step Solution
There are 3 Steps involved in it
1 Expert Approved Answer
Step: 1 Unlock

Question Has Been Solved by an Expert!
Get step-by-step solutions from verified subject matter experts
Step: 2 Unlock
Step: 3 Unlock