

Question: NOTE: QUESTION NEEDS TO BE ANSWERED IN EXACT WAY A small - town Taxi operates one vehicle during the 9 : 0 0 AM to
NOTE: QUESTION NEEDS TO BE ANSWERED IN EXACT WAY
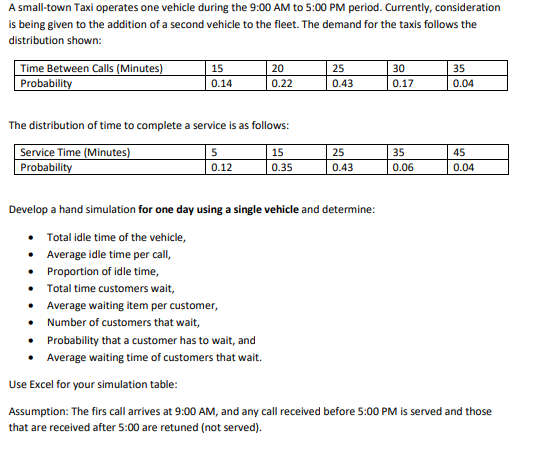
A smalltown Taxi operates one vehicle during the : AM to : PM period. Currently, consideration
is being given to the addition of a second vehicle to the fleet. The demand for the taxis follows the
distribution shown:
The distribution of time to complete a service is as follows:
Develop a hand simulation for one day using a single vehicle and determine:
Total idle time of the vehicle,
Average idle time per call,
Proportion of idle time,
Total time customers wait,
Average waiting item per customer,
Number of customers that wait,
Probability that a customer has to wait, and
Average waiting time of customers that wait.
Use Excel for your simulation table:
Assumption: The firs call arrives at : AM and any call received before : PM is served and those
that are received after : are retuned not served
Call
RD for Time Between Calls
Time Between Calls
Call time Clock
RD for Service Time
Service Time
Service Time Begins
Time Customer Waites
Time Service Ends
Time Customer in System
Idel Time of Taxi NA Total
Random digit is equivalent to in Excel
Random digit is equivalent to in Excel A smalltown Taxi operates one vehicle during the : AM to : PM period. Currently, consideration is being given to the addition of a second vehicle to the fleet. The demand for the taxis follows the distribution shown:
The distribution of time to complete a service is as follows:
Develop a hand simulation for one day using a single vehicle and determine:
Total idle time of the vehicle,
Average idle time per call,
Proportion of idle time,
Total time customers wait,
Average waiting item per customer,
Number of customers that wait,
Probability that a customer has to wait, and
Average waiting time of customers that wait.
Use Excel for your simulation table:
Assumption: The firs call arrives at : AM and any call received before : PM is served and those that are received after : are retuned not served A smalltown Taxi operates one vehicle during the : AM to : PM period. Currently, consideration is being given to the addition of a second vehicle to the fleet. The demand for the taxis follows the distribution shown:
The distribution of time to complete a service is as follows:
Develop a hand simulation for one day using a single vehicle and determine:
Total idle time of the vehicle,
Average idle time per call,
Proportion of idle time,
Total time customers wait,
Average waiting item per customer,
Number of customers that wait,
Probability that a customer has to wait, and
Average waiting time of customers that wait.
Use Excel for your simulation table:
Assumption: The firs call arrives at : AM and any call received before : PM is served and those that are received after : are retuned not servedbegintabularccccccccccc
hline Call & begintabularl
RD for
Time
Between
Calls
endtabular & begintabularl
Time
Between
Calls
endtabular & begintabularl
Call time
Clock
endtabular & begintabularl
RD for
Service
Time
endtabular & begintabularl
Service
Time
endtabular & begintabularl
Service
Time
Begins
endtabular & begintabularl
Time
Customer
Waites
endtabular & begintabularl
Time
Service
Ends
endtabular & begintabularl
Time
Customer
in System
endtabular & Idel Time of Taxi
hline & NA & & & & & & & & &
hline & & & & & & & & & &
hline & & & & & & & & & &
hline & & & & & & & & & &
hline & & & & & & & & & &
hline & & & & & & & & & &
hline & & & & & & & & & &
hline & & & & & & & & & &
hline & & & & & & & & & &
hline & & & & & & & & & &
hline & & & & & & & & & &
hline & & & & & & & & & &
hline & & & & & & & & & &
hline & & & & & & & & & &
hline & & & & & & & & & &
hline & & & & & & & & & &
hline & & & & & & & & & &
hline & & & & & & & & & &
hline & & & & & & & & & &
hline & & & & & & & & & &
hline & & & & & & & & & &
hline & & & & & & & & & &
hline Total & & & & & & & & & &
hline
endtabular
Random digit is equivalent to in Excel
Random digit is equivalent to in Excel
Step by Step Solution
There are 3 Steps involved in it
1 Expert Approved Answer
Step: 1 Unlock

Question Has Been Solved by an Expert!
Get step-by-step solutions from verified subject matter experts
Step: 2 Unlock
Step: 3 Unlock