

Question: Note that operating lease assets and liabilities are operating items instead of non-operating. Make a list of all operating or non-operating from income statement and
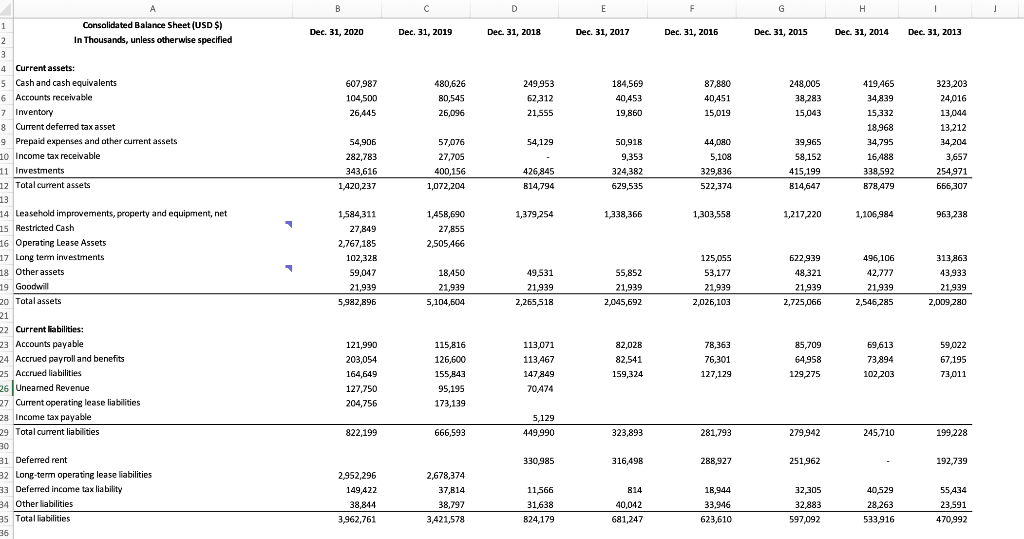
Note that operating lease assets and liabilities are operating items instead of non-operating. Make a list of all operating or non-operating from income statement and balance sheet items.
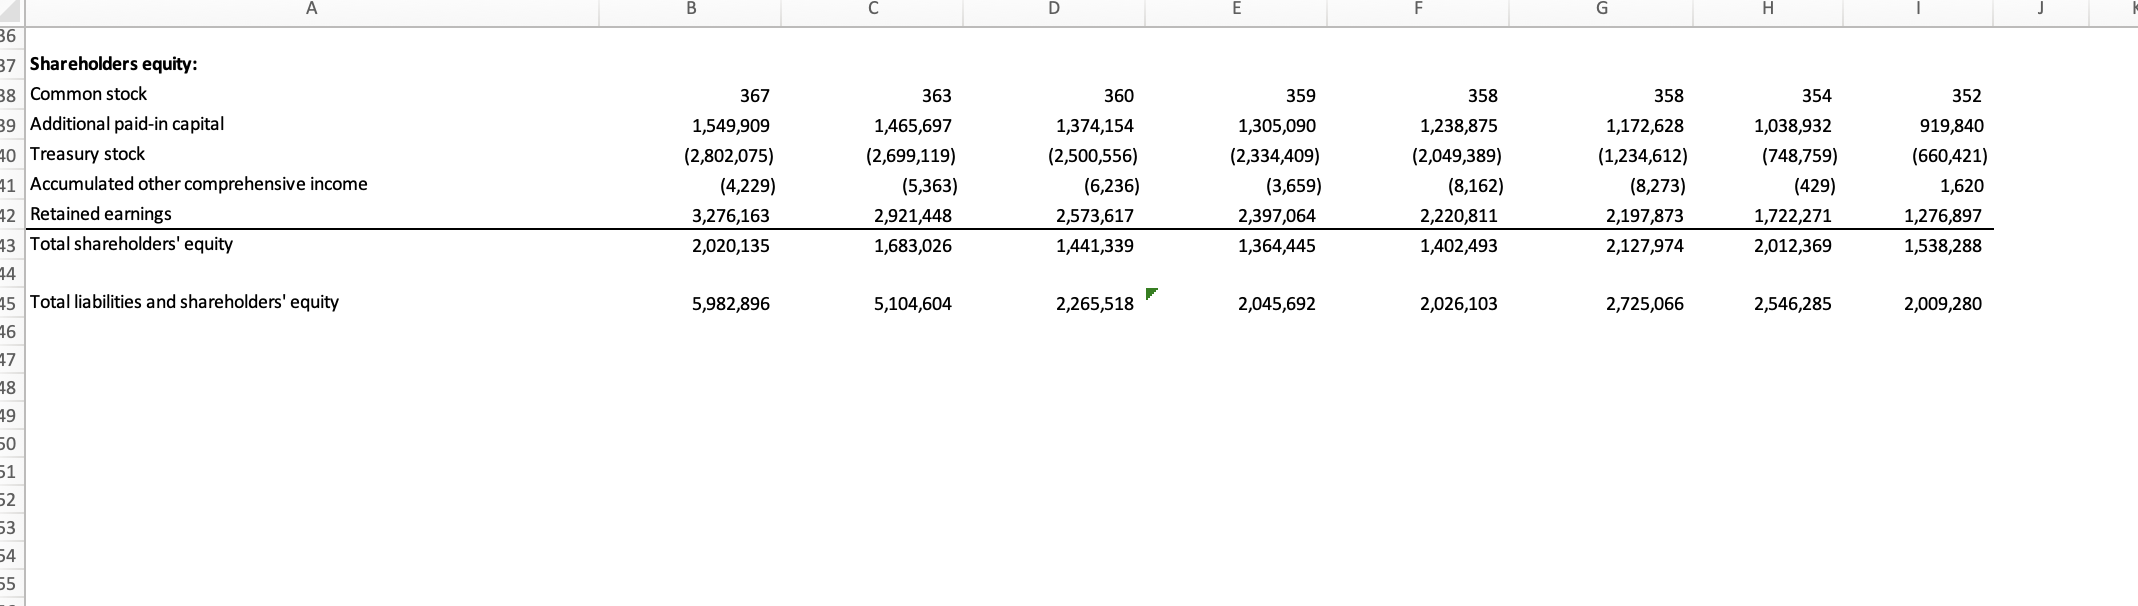
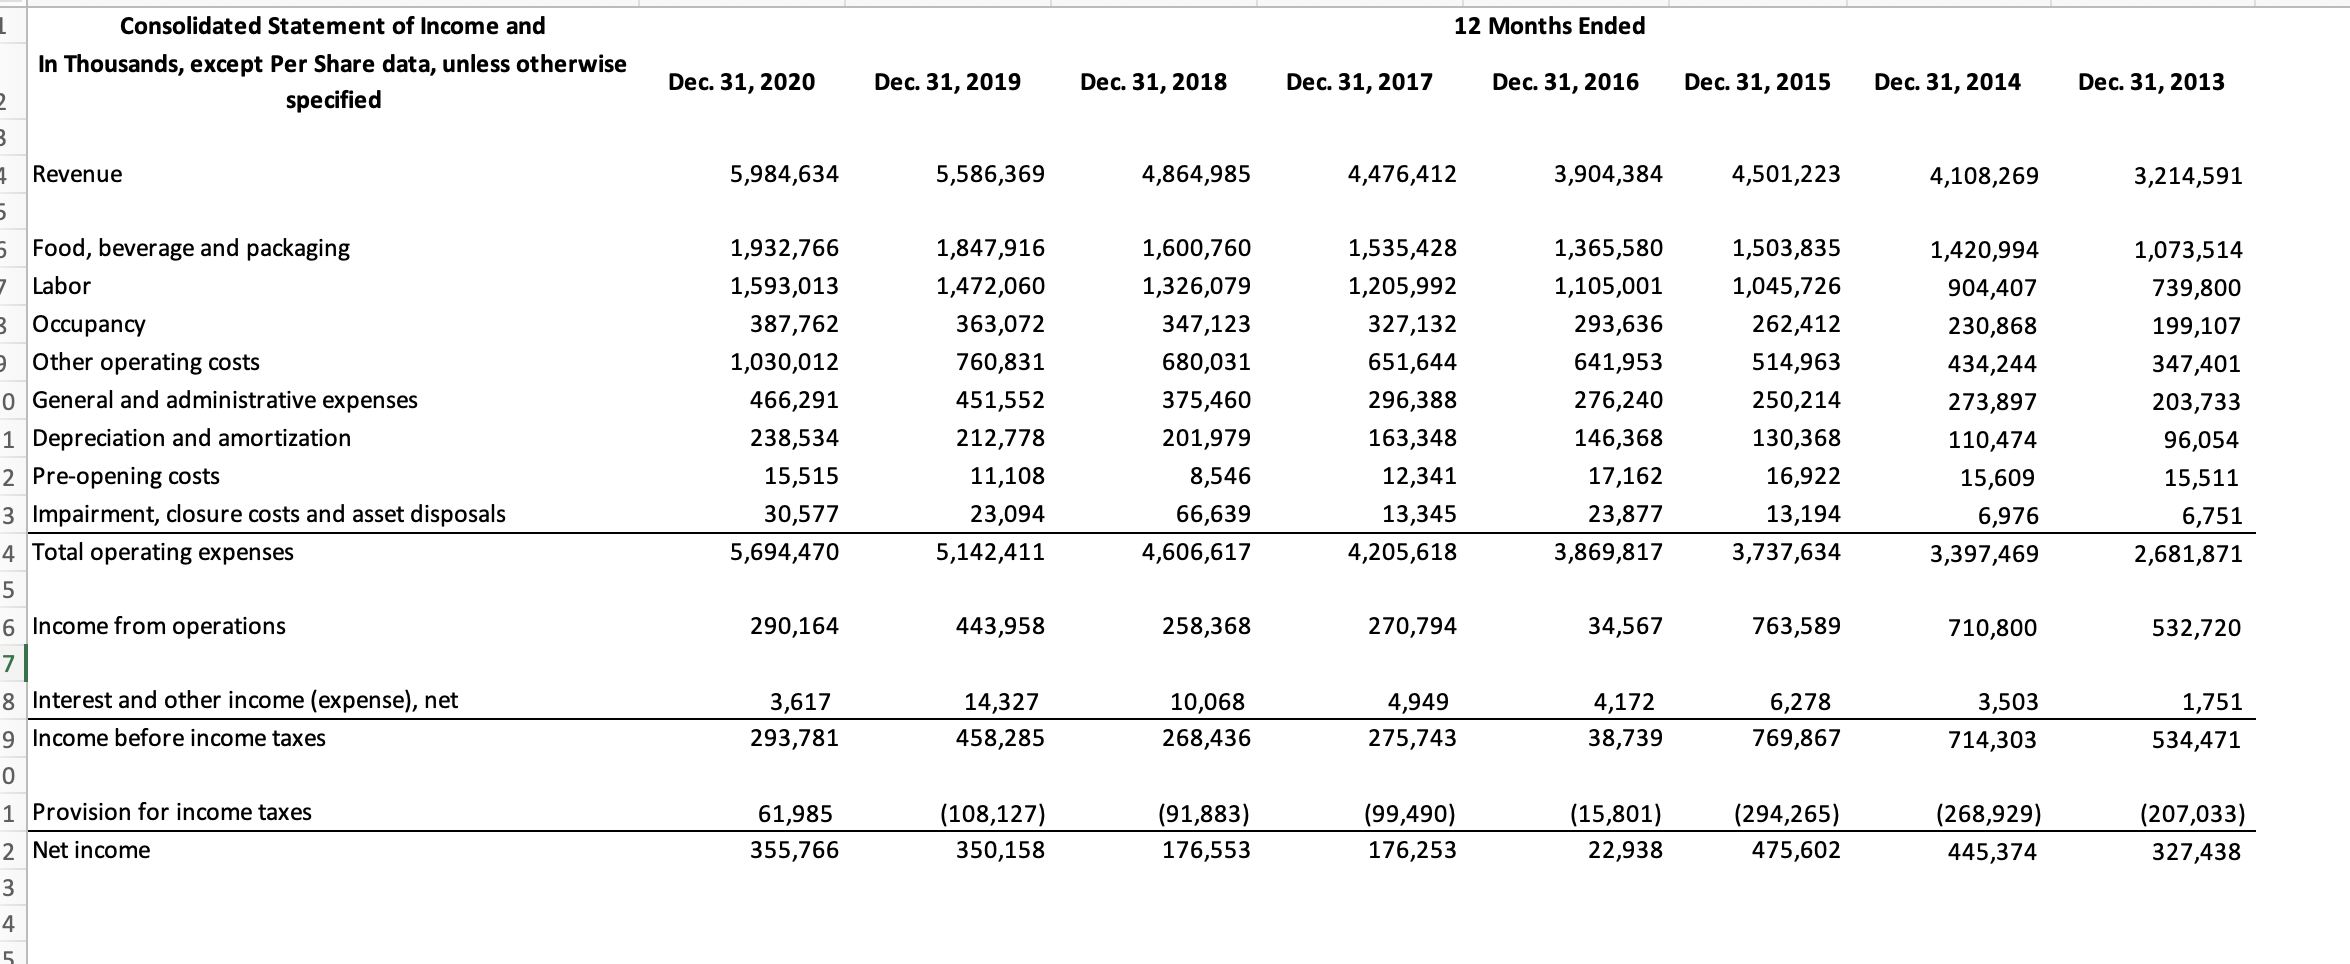
For Dec. 31 2018, Dec.31 2019, Dec.31 2020 perform a complete disaggregation of ROE. Use of formula in excel. Statutory tax rate for federal and state tax is 21%
B D E F G H 1 Dec 31, 2020 Dec 31, 2019 Dec 31, 2018 Dec 31, 2017 Dec 31, 2016 Dec 31, 2015 Dec 31, 2014 Dec 31, 2013 607,987 104,500 26,445 480,626 80,545 26,096 249,953 62 312 21,555 184,569 40,453 19,860 87,880 40,451 15,019 248,005 38,283 15,043 419,465 34839 15,332 18,968 34,795 16,488 338,592 878,479 323,203 24,016 13,044 13,212 34,204 3,657 254971 666 307 54,129 54,901 282,783 343,616 1,420,237 57,076 27,705 400,156 1,072,204 50,918 9,353 324,382 629,535 44,080 5,108 329,836 522,374 39,965 58,152 415,199 314,647 426,845 814,794 1,379,254 1,338,366 1,303,558 1,217220 1,106,984 963,238 1,458,690 27,855 2,505466 1 Consolidated Balance Sheet (USD $) 2 2 In Thousands, unless otherwise specified 3 4 Current assets: 5 Cash and cash equivalents 6 Accounts receivable 7 Inventory 8 Current deferred tax asset 9 Prepaid expenses and other current assets 10 Income tax receivable 11 Investments 12 Total current assets 13 14 Leasehold improvements, property and equipment, net 15 Restricted Cash 16 Operating Lease Assets 17 Long term investments 18 Other assets 19 Goodwill 20 Total assets 21 22 Current liabilities: 23 Accounts payable 24 Accrued payroll and benefits 25 Accrued liabilities 26 Uneamed Revenue 27 Current operating lease liabilities 28 Income tax payable 29 Total current liabilities 30 31 Deferred rent 32 Long-term operating lease liabilities 33 Deferred income tax liability 34 Other liabilities as Total liabilities 36 1,584,311 27,849 2,767,185 102,328 59,047 21,939 5,982,896 18.450 21,939 5,104,6044 49,531 21939 2,265 518 55,852 21,939 2,045,692 125,055 53,177 21,939 2,026,103 622939 48,321 21939 496,106 42,777 21939 2,546,285 313863 43,933 21,939 2,009,280 2,725,066 121,990 203,054 164,649 127,750 204,756 115,816 126,600 155,843 95,195 173,139 113,071 113 467 147849 70,474 82,028 82,541 159,324 78,363 76,301 127,129 85,709 64,958 129275 69,613 73 894 102 203 59,022 67,195 73,011 5,129 449,990 822,199 666,593 323,893 281,793 279,942 245,710 199 228 330985 316,498 288,927 251,962 192,739 814 2,952,296 149,422 38,844 3,962,761 2,678,374 37,814 38,797 3,421,578 11566 31,638 824,179 40,042 681,247 18,944 33,946 623,610 32,305 32 883 597092 40,529 28,263 533,916 55,434 23,591 470,992 B D E F G H 367 363 360 359 358 354 352 1,549,909 (2,802,075) (4,229) 3,276,163 2,020,135 1,465,697 (2,699,119) (5,363) 2,921,448 1,683,026 1,374,154 (2,500,556) (6,236) 2,573,617 1,441,339 1,305,090 (2,334,409) (3,659) 2,397,064 1,364,445 1,238,875 (2,049,389) (8,162) 2,220,811 1,402,493 358 1,172,628 (1,234,612) (8,273) 2,197,873 2,127,974 1,038,932 (748,759) (429) 1,722,271 2,012,369 919,840 (660,421) 1,620 1,276,897 1,538,288 A 36 37 Shareholders equity: 38 Common stock 89 Additional paid-in capital 40 Treasury stock 41 Accumulated other comprehensive income 42 Retained earnings 43 Total shareholders' equity 14 45 Total liabilities and shareholders' equity 16 17 18 79 50 51 52 53 54 55 5,982,896 5,104,604 2,265,518 2,045,692 2,026,103 2,725,066 2,546,285 2,009,280 1 12 Months Ended Consolidated Statement of Income and In Thousands, except Per Share data, unless otherwise specified Dec. 31, 2020 Dec. 31, 2019 Dec. 31, 2018 Dec. 31, 2017 Dec. 31, 2016 Dec. 31, 2015 Dec. 31, 2014 Dec. 31, 2013 2 3 7 Revenue 5,984,634 5,586,369 4,864,985 4,476,412 3,904,384 4,501,223 4,108,269 3,214,591 5 5 Food, beverage and packaging 7 Labor B Occupancy Other operating costs o General and administrative expenses 1 Depreciation and amortization 2 Pre-opening costs 3 Impairment, closure costs and asset disposals 4 Total operating expenses 5 6 Income from operations 7 8 Interest and other income (expense), net 9 Income before income taxes 0 1 Provision for income taxes 2 Net income 1,932,766 1,593,013 387,762 1,030,012 466,291 238,534 15,515 30,577 5,694,470 1,847,916 1,472,060 363,072 760,831 451,552 212,778 11,108 23,094 5,142,411 1,600,760 1,326,079 347,123 680,031 375,460 201,979 8,546 66,639 4,606,617 1,535,428 1,205,992 327,132 651,644 296,388 163,348 12,341 13,345 4,205,618 1,365,580 1,105,001 293,636 641,953 276,240 146,368 17,162 23,877 3,869,817 1,503,835 1,045,726 262,412 514,963 250,214 130,368 16,922 13,194 3,737,634 1,420,994 904,407 230,868 434,244 273,897 110,474 15,609 6,976 3,397,469 1,073,514 739,800 199,107 347,401 203,733 96,054 15,511 6,751 2,681,871 290,164 443,958 258,368 270,794 34,567 763,589 710,800 532,720 3,617 293,781 14,327 458,285 10,068 268,436 4,949 275,743 4,172 38,739 6,278 769,867 3,503 714,303 1,751 534,471 61,985 355,766 (108,127) 350,158 (91,883) 176,553 (99,490) 176,253 (15,801) 22,938 (294,265) 475,602 (268,929) 445,374 (207,033) 327,438 3 4 5
Step by Step Solution
There are 3 Steps involved in it

Get step-by-step solutions from verified subject matter experts