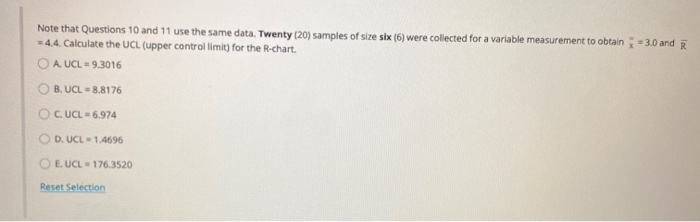
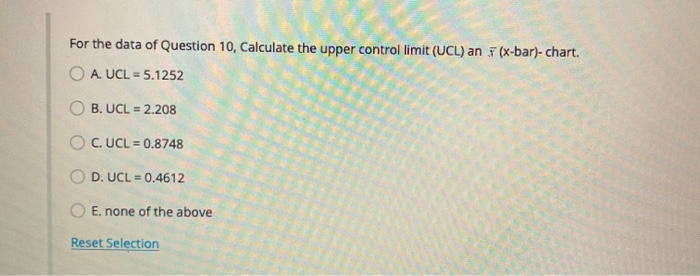
Question: Note that Questions 10 and 11 use the same data. Twenty (20) samples of size six (6) were collected for a variable measurement to obtain

Note that Questions 10 and 11 use the same data.
Note that Questions 10 and 11 use the same data. Twenty (20) samples of size six (6) were collected for a variable measurement to obtain ; -3.0 and = 4.4. Calculate the UCL (upper controllimit) for the R-chart. O A UCL = 9,3016 OB. UCL = 8.8176 OC.UCL6.974 OD. UCL - 1.4696 E. UCL 176,3520 Reset Selection For the data of Question 10, Calculate the upper controllimit (UCL) an F(x-bar)-chart. A. UCL = 5.1252 B.UCL = 2.208 O C. UCL = 0.8748 D. UCL = 0.4612 O E. none of the above Reset Selection

Step by Step Solution

There are 3 Steps involved in it

1 Expert Approved Answer
Step: 1 Unlock blur-text-image
Question Has Been Solved by an Expert!

Get step-by-step solutions from verified subject matter experts

Step: 2 Unlock
Step: 3 Unlock

Students Have Also Explored These Related General Management Questions!