

Question: Note: The answer should be typed. 4. The Laffer curve Government-imposed taxes cause reductions in the activity that is being taxed, which has important implications

Note: The answer should be typed.


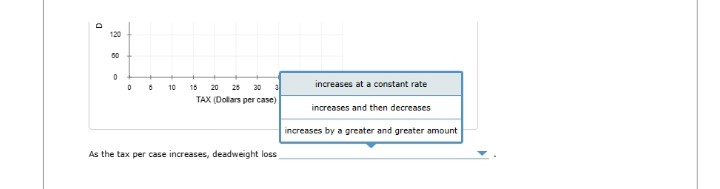
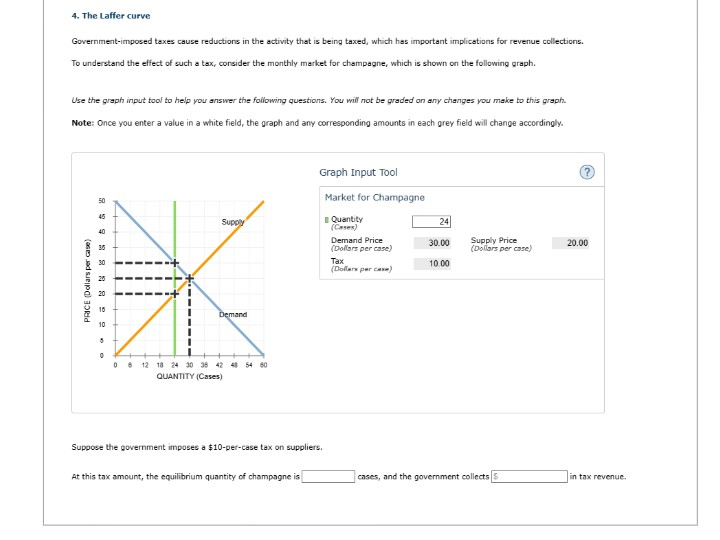
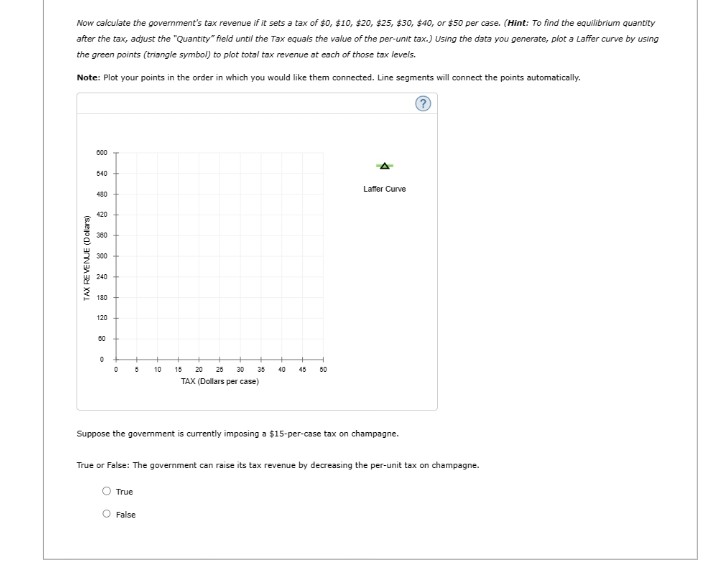
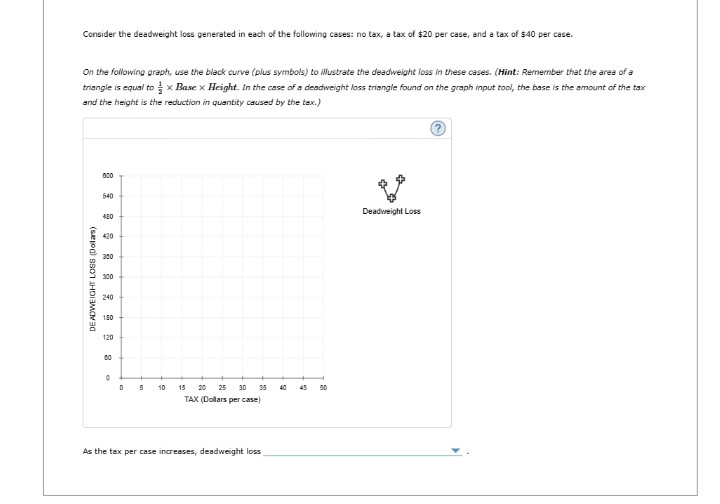
4. The Laffer curve Government-imposed taxes cause reductions in the activity that is being taxed, which has important implications for revenue collections. To understand the effect of such a tax, consider the monthly market for champagne, which is shown on the following graph. Use the graph input tool to help you answer the following questions. You will not be graded on any changes you make to this graph. Note: Once you enter a value in a white field, the graph and any corresponding amounts in each grey field will change accordingly. Graph Input Tool (?) Market for Champagne Supply I Quantity 24 Demand Price 30.00 Supply Price 20.00 (Dollars per case) (Dollars per case) Tax 10 00 (Dollars per case) PRICE (Dollars per Gise) Demand 8 12 10 24 30 35 42 48 54 60 QUANTITY (Cases) Suppose the government imposes a $10-per-case tex on suppliers. At this tax amount, the equilibrium quantity of champagne is cases, and the government collects 5 in tax revenue.Now calculate the government's tax revenue if it sets a tax of $0, $10, $20, $25, $30, $40, or $50 per case. (Hint: To find the equilibrium quantity after the tax, adjust the "Quantity" field until the Tax equals the value of the per-unit tax.) Using the data you generate, plot a Laffer curve by using the green points (triangle symbol) to plot total tax revenue at each of those tox levels. Note: Plot your points in the order in which you would like them connected. Line segments will connect the points automatically. B40 Laffer Curve 420 380 900 TAX REVENUE (Dollars) 240 130 120 10 19 20 20 30 35 40 45 TAX (Dollars per case) Suppose the government is currently imposing a $15-per-case tax on champagne. True or False: The government can raise its tax revenue by decreasing the per-unit tax on champagne. True O FalseConsider the deadweight loss generated in each of the following cases: no tax, a tax of $20 per case, and a tax of $40 per case. On the following graph, use the black curve (plus symbols) to Mustrate the deadweight loss in these cases. (Hint: Remember that the area of a triangle is equal to = x Base x Height. In the case of a deadweight loss triangle found on the graph input tool, the base is the amount of the tax and the height is the reduction in quantity caused by the tax.) 540 Deadweight Loss 300 DEADWEIGHT LOSS (Dollars) 240 180 120 10 1 20 25 30 35 40 45 50 TAX (Dollars per case) As the tax per case increases, deadweight loss10 15 20 30 increases at a constant rate TAX (Dollars per case) increases and then decreases increases by a greater and greater amount As the tax per case increases, deadweight loss
Step by Step Solution
There are 3 Steps involved in it

Get step-by-step solutions from verified subject matter experts