

Question: Note: the answer should be typed. QUESTION 31 . 1 POINT The data below represents the price level, the aggregate demand, and the aggregate supply
Note: the answer should be typed.
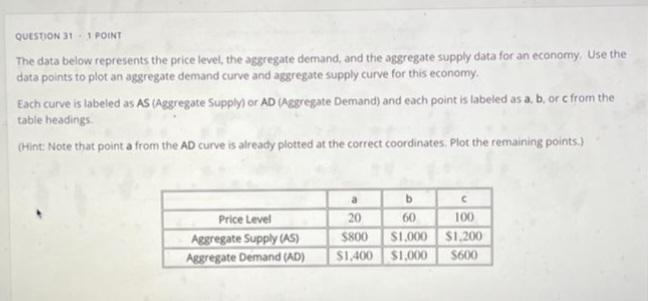
QUESTION 31 . 1 POINT The data below represents the price level, the aggregate demand, and the aggregate supply data for an economy. Use the data points to plot an aggregate demand curve and aggregate supply curve for this economy. Each curve is labeled as AS (Aggregate Supply) or AD (Aggregate Demand) and each point is labeled as a, b, or c from the table headings. (Hint: Note that point a from the AD curve is already plotted at the correct coordinates. Plot the remaining points.) b C Price Level 20 60 100 Aggregate Supply (AS) $800 $1,000 $1.200 Aggregate Demand (AD) $1,400 $1.000 $600
Step by Step Solution
There are 3 Steps involved in it
1 Expert Approved Answer
Step: 1 Unlock

Question Has Been Solved by an Expert!
Get step-by-step solutions from verified subject matter experts
Step: 2 Unlock
Step: 3 Unlock