

Question: Note they are no dividends. a. Question 4 (20 points, Chapter 11 and 12): Risk and Return Download the Excel File provided with the assignment.
Note they are no dividends.
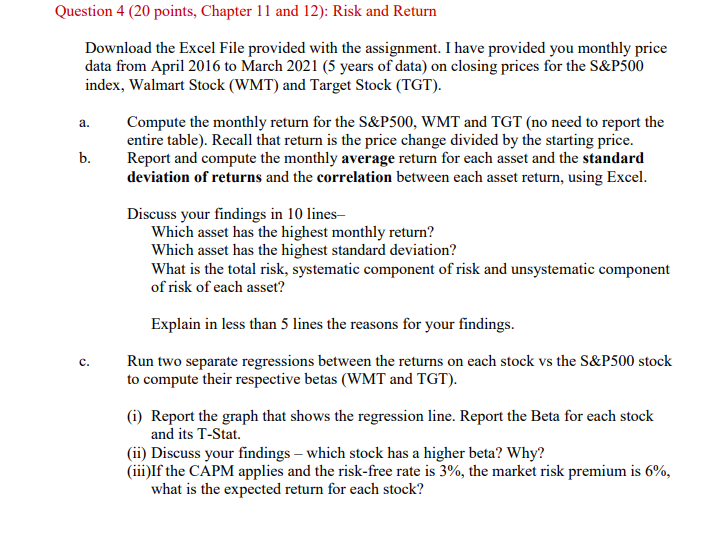
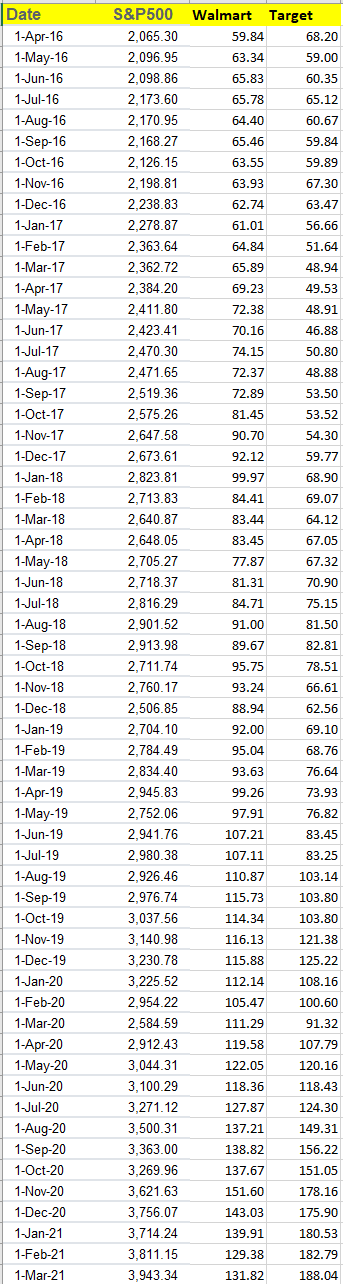
a. Question 4 (20 points, Chapter 11 and 12): Risk and Return Download the Excel File provided with the assignment. I have provided you monthly price data from April 2016 to March 2021 (5 years of data) on closing prices for the S&P500 index, Walmart Stock (WMT) and Target Stock (TGT). Compute the monthly return for the S&P500, WMT and TGT (no need to report the entire table). Recall that return is the price change divided by the starting price. b. Report and compute the monthly average return for each asset and the standard deviation of returns and the correlation between each asset return, using Excel. Discuss your findings in 10 lines- Which asset has the highest monthly return? Which asset has the highest standard deviation? What is the total risk, systematic component of risk and unsystematic component of risk of each asset? Explain in less than 5 lines the reasons for your findings. Run two separate regressions between the returns on each stock vs the S&P500 stock to compute their respective betas (WMT and TGT). (1) Report the graph that shows the regression line. Report the Beta for each stock and its T-Stat. (ii) Discuss your findings which stock has a higher beta? Why? (iii)If the CAPM applies and the risk-free rate is 3%, the market risk premium is 6%, what is the expected return for each stock? Date 1-Apr-16 1-May-16 1-Jun-16 1-Jul-16 1-Aug-16 1-Sep-16 1-Oct-16 1-Nov-16 1-Dec-16 1-Jan-17 1-Feb-17 1-Mar-17 1-Apr-17 1-May-17 1-Jun-17 1-Jul-17 1-Aug-17 1-Sep-17 1-Oct-17 1-Nov-17 1-Dec-17 1-Jan-18 1-Feb-18 1-Mar-18 1-Apr-18 1-May-18 1-Jun-18 1-Jul-18 1-Aug-18 1-Sep-18 1-Oct-18 1-Nov-18 1-Dec-18 1-Jan-19 1-Feb-19 1-Mar-19 1-Apr-19 1-May-19 1-Jun-19 1-Jul-19 1-Aug-19 1-Sep-19 1-Oct-19 1-Nov-19 1-Dec-19 1-Jan-20 1-Feb-20 1-Mar-20 1-Apr-20 1-May-20 1-Jun-20 1-Jul-20 1-Aug-20 1-Sep-20 1-Oct-20 1-Nov-20 1-Dec-20 1-Jan-21 1-Feb-21 1-Mar-21 67.05 S&P500 2,065.30 2,096.95 2,098.86 2,173.60 2,170.95 2,168.27 2,126.15 2,198.81 2,238.83 2,278.87 2,363.64 2,362.72 2,384.20 2,411.80 2,423.41 2,470.30 2,471.65 2,519.36 2,575.26 2,647.58 2,673.61 2,823.81 2,713.83 2,640.87 2,648.05 2,705.27 2,718.37 2,816.29 2,901.52 2,913.98 2,711.74 2,760.17 2,506.85 2,704.10 2,784.49 2,834.40 2,945.83 2,752.06 2,941.76 2,980.38 2,926.46 2,976.74 3,037.56 3,140.98 3,230.78 3,225.52 2,954.22 2,584.59 2,912.43 3,044.31 3,100.29 3,271.12 3,500.31 3,363.00 3,269.96 3,621.63 3,756.07 3,714.24 3,811.15 3,943.34 Walmart Target 59.84 68.20 63.34 59.00 65.83 60.35 65.78 65.12 64.40 60.67 65.46 59.84 63.55 59.89 63.93 67.30 62.74 63.47 61.01 56.66 64.84 51.64 65.89 48.94 69.23 49.53 72.38 48.91 70.16 46.88 74.15 50.80 72.37 48.88 72.89 53.50 81.45 53.52 90.70 54.30 92.12 59.77 99.97 68.90 84.41 69.07 83.44 64.12 83.45 77.87 67.32 81.31 70.90 84.71 75.15 91.00 81.50 89.67 82.81 95.75 78.51 93.24 66.61 88.94 62.56 92.00 69.10 95.04 68.76 93.63 76.64 99.26 73.93 97.91 76.82 107.21 83.45 107.11 83.25 110.87 103.14 115.73 103.80 114.34 103.80 116.13 121.38 115.88 125.22 112.14 108.16 105.47 100.60 111.29 91.32 119.58 107.79 122.05 120.16 118.43 124.30 118.36 127.87 137.21 138.82 137.67 149.31 156.22 151.60 143.03 139.91 129.38 131.82 151.05 178.16 175.90 180.53 182.79 188.04
Step by Step Solution
There are 3 Steps involved in it

Get step-by-step solutions from verified subject matter experts