

Question: NOTE: This article describes economic activity from 2 0 2 2 - 2 3 . Inflation ticked up in March in yet another sign that
NOTE: This article describes economic activity from
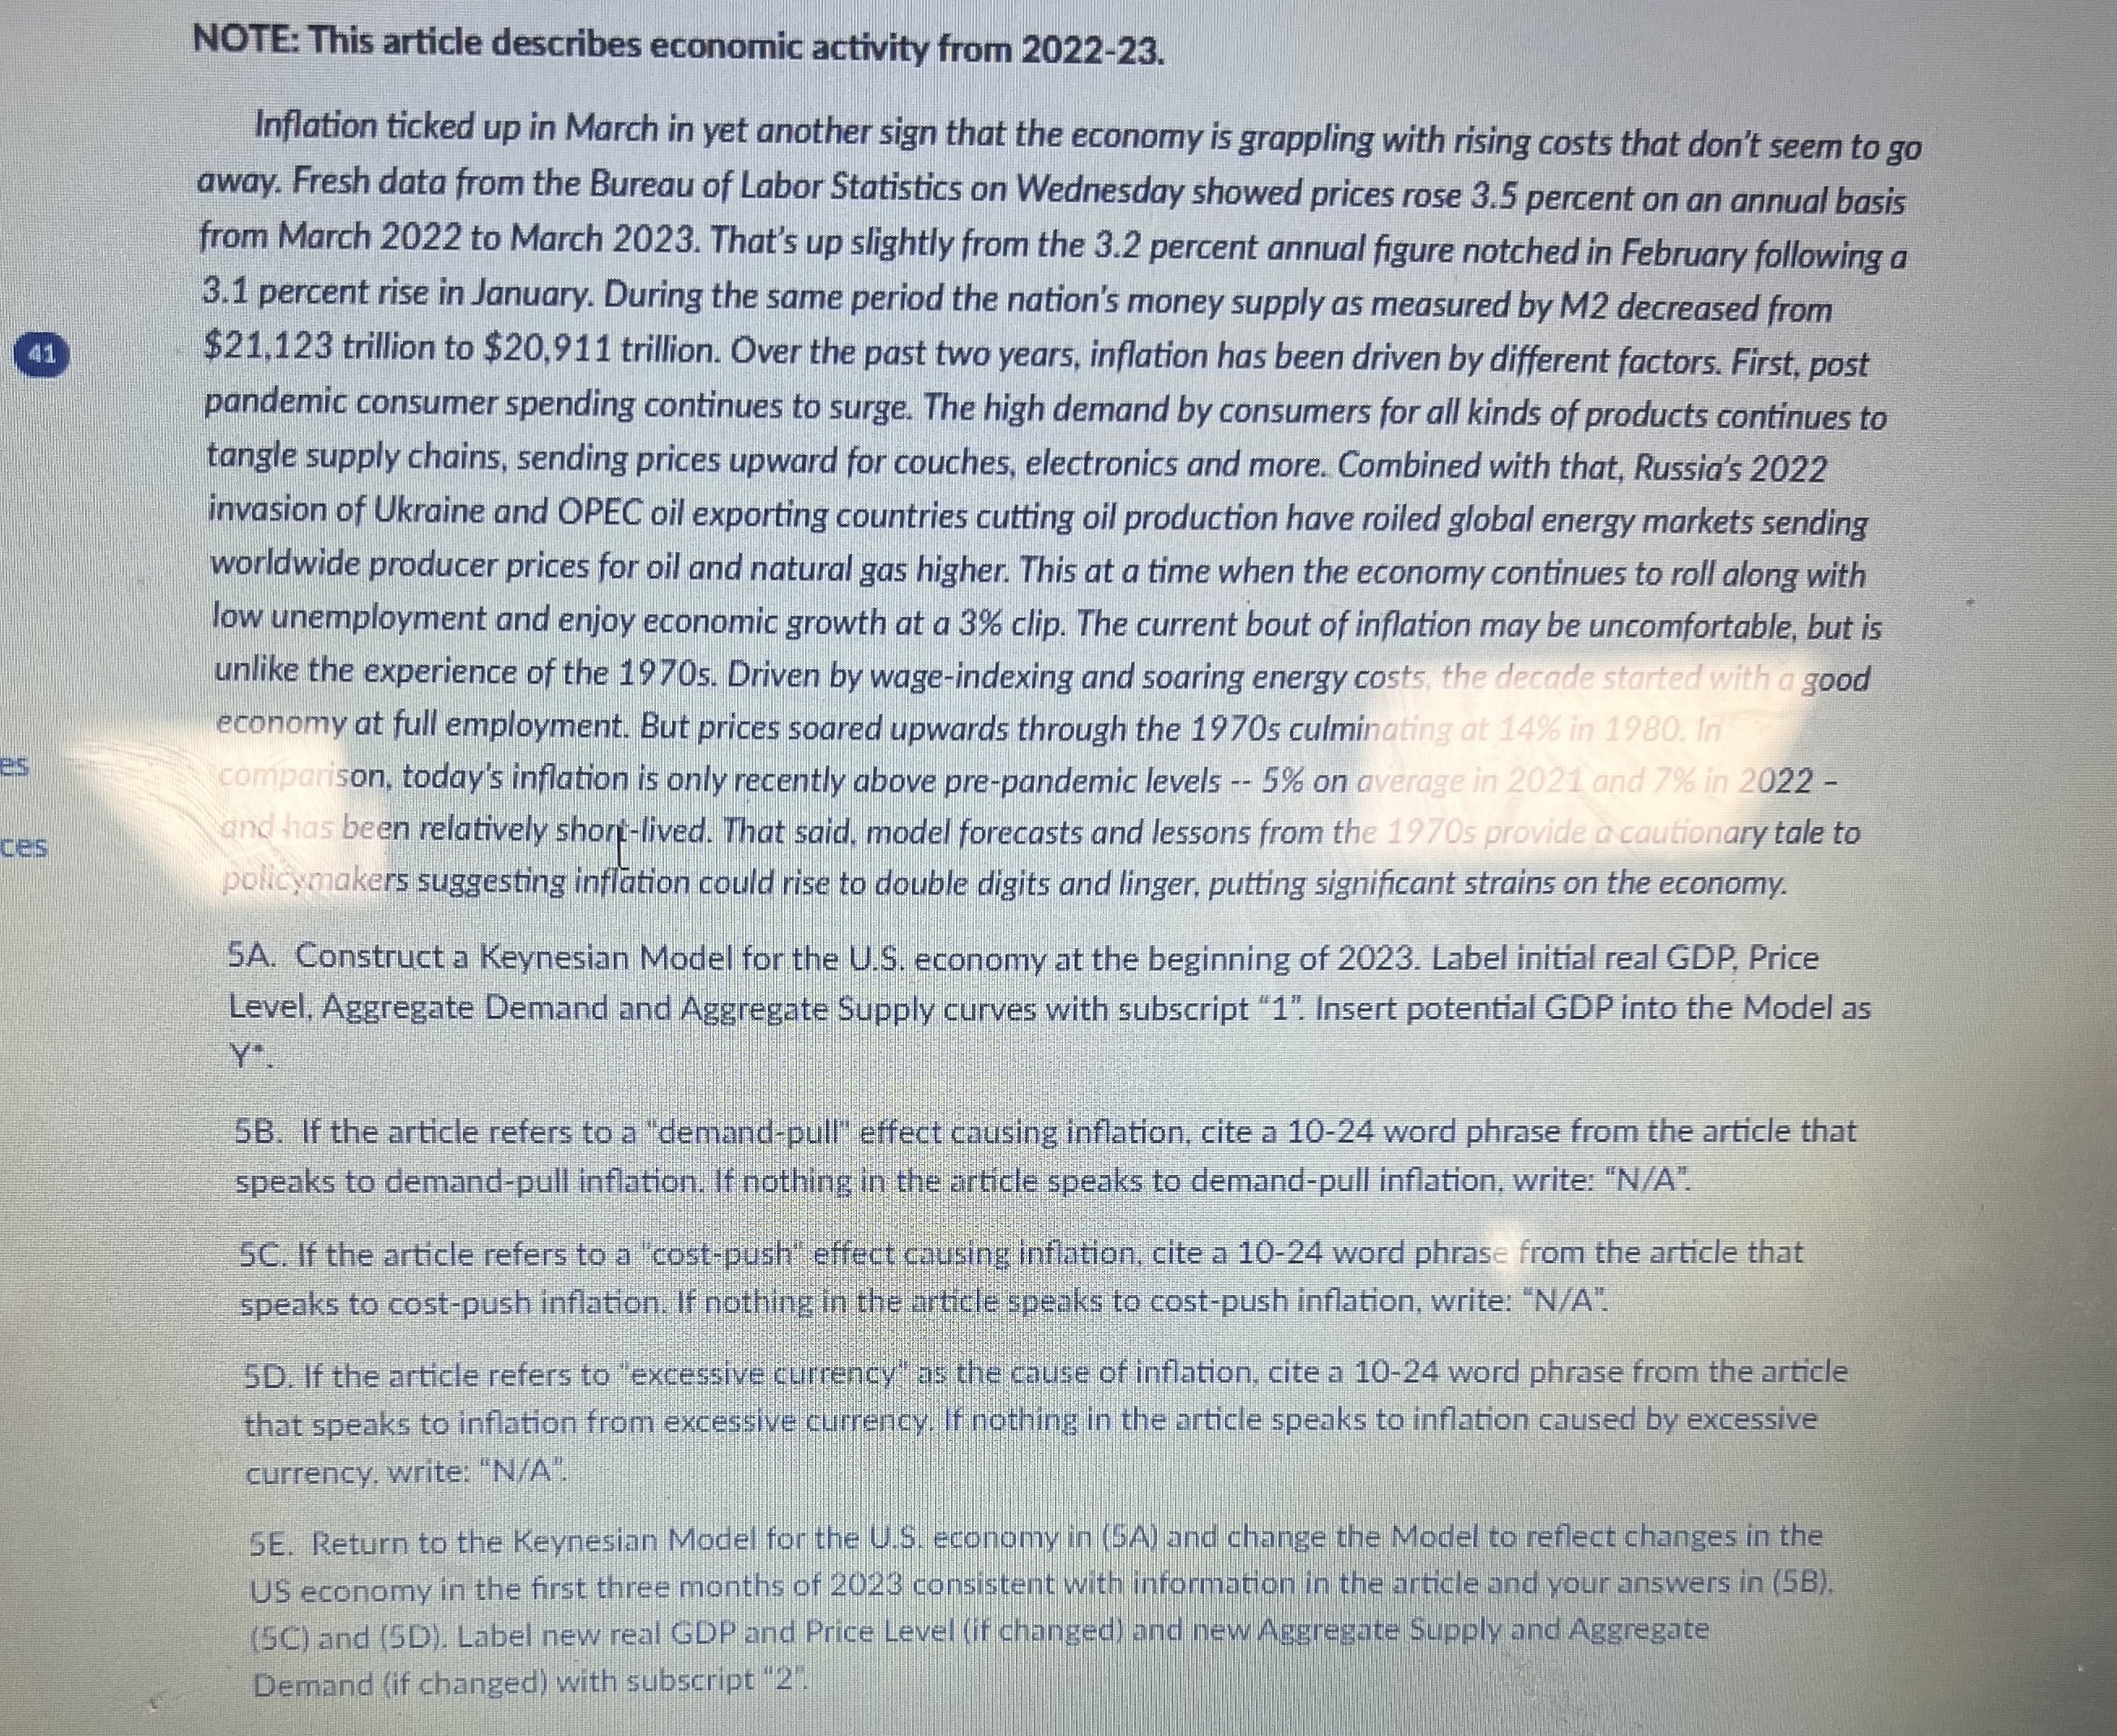
Inflation ticked up in March in yet another sign that the economy is grappling with rising costs that don't seem to go away. Fresh data from the Bureau of Labor Statistics on Wednesday showed prices rose percent on an annual basis from March to March That's up slightly from the percent annual figure notched in February following a percent rise in January. During the same period the nation's money supply as measured by M decreased from
$ trillion to $ trillion. Over the past two years, inflation has been driven by different factors. First, post pandemic consumer spending continues to surge. The high demand by consumers for all kinds of products continues to tangle supply chains, sending prices upward for couches, electronics and more. Combined with that, Russia's invasion of Ukraine and OPEC oil exporting countries cutting oil production have roiled global energy markets sending worldwide producer prices for oil and natural gas higher. This at a time when the economy continues to roll along with low unemployment and enjoy economic growth at a clip. The current bout of inflation may be uncomfortable, but is unlike the experience of the s Driven by wageindexing and soaring energy costs, the decade started with a good economy at full employment. But prices soared upwards through the s culminating at in In comparison, today's inflation is only recently above prepandemic levels on average in and in and thas been relatively shorilived. That said, model forecasts and lessons from the sprovide a cautionary tale to policymakers suggesting inflation could rise to double digits and linger, putting significant strains on the economy.
A Construct a Keynesian Model for the US economy at the beginning of Label initial real GDP Price Level, Aggregate Demand and Aggregate Supply curves with subscript Insert potential GDP into the Model as r
B If the article refers to a "demandpull" effect causing inflation, cite a word phrase from the article that speaks to demandpull inflation. If nothing in the article speaks to demandpull inflation, write: NA
C If the article refers to a costpush" effect causing inflation, cite a word phrase from the article that speaks to costpush inflation. If nothing in the article speaks to costpush inflation, write: NA
D If the article refers to "excessive currency" as the cause of inflation, cite a word phrase from the article that speaks to inflation from excessive currency. If nothing in the article speaks to inflation caused by excessive currency, write: NA
SE Return to the Keynesian Model for the US Economy in SA and change the Model to reflect changes in the US economy in the first three months of consistent with information in the article and your answers in BSC and SD Label new real GDP and Price Level if changed and new Aggregate Supply and Aggregate Demand if changed with subscript
Step by Step Solution
There are 3 Steps involved in it
1 Expert Approved Answer
Step: 1 Unlock

Question Has Been Solved by an Expert!
Get step-by-step solutions from verified subject matter experts
Step: 2 Unlock
Step: 3 Unlock