

Question: note: Using the balance sheets, prepare a vertical common-size analysis for the company in year 2010 and 2011. Use total assets as a base. Comment
note:
- Using the balance sheets, prepare a vertical common-size analysis for the company in year 2010 and 2011. Use total assets as a base. Comment on significant trends that appear
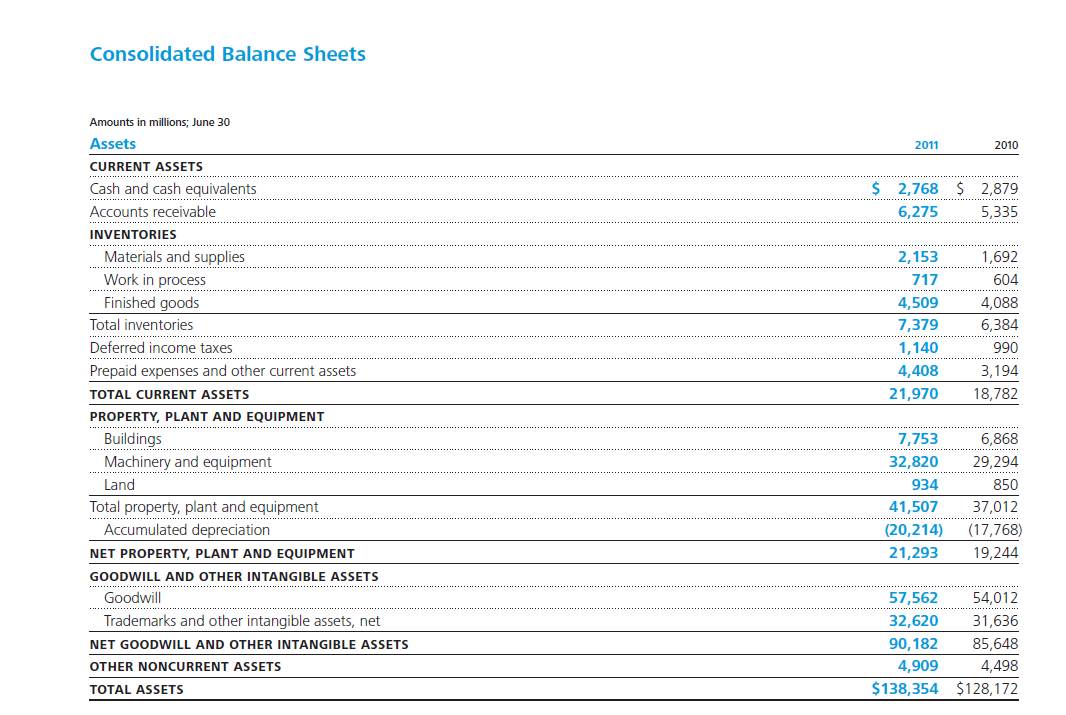
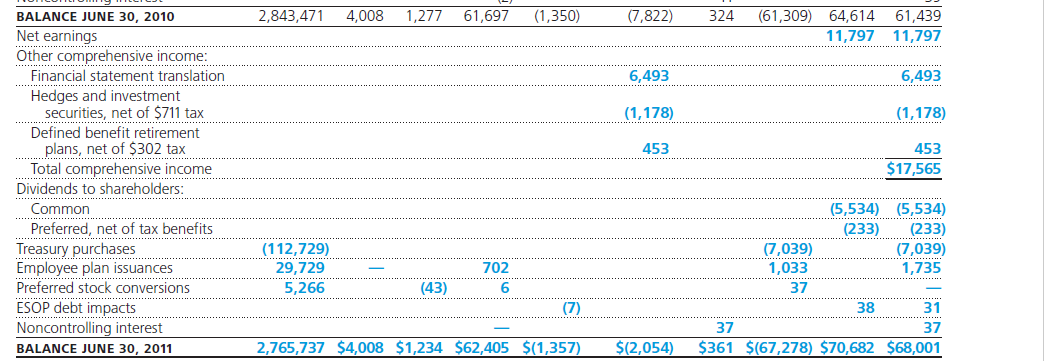
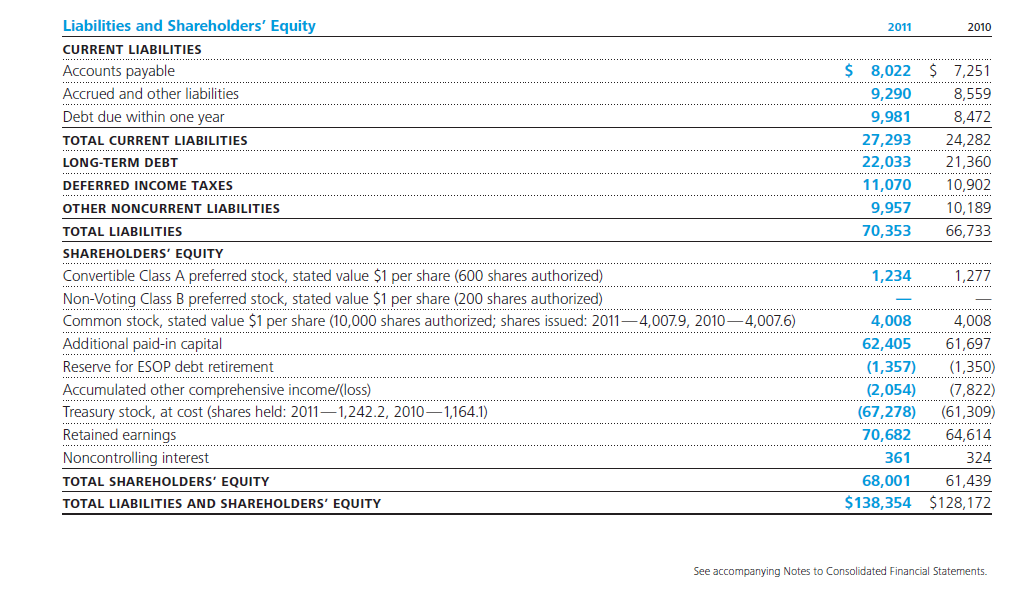
Consolidated Balance Sheets 2011 2010 $ 2,768 $ 2,879 6,275 5,335 Amounts in millions, June 30 Assets CURRENT ASSETS Cash and cash equivalents Accounts receivable INVENTORIES Materials and supplies Work in process Finished goods Total inventories Deferred income taxes Prepaid expenses and other current assets TOTAL CURRENT ASSETS PROPERTY, PLANT AND EQUIPMENT Buildings and 2,153 717 4,509 7,379 1,140 4,408 21,970 1,692 604 4,088 6,384 990 3,194 18,782 6,868 29,294 Land 850 7,753 32,820 934 41,507 (20,214) 21,293 37,012 (17,768) 19,244 Total property, plant and equipment Accumulated depreciation NET PROPERTY, PLANT AND EQUIPMENT GOODWILL AND OTHER INTANGIBLE ASSETS Goodwill Trademarks and other intangible assets, net NET GOODWILL AND OTHER INTANGIBLE ASSETS OTHER NONCURRENT ASSETS TOTAL ASSETS 57,562 54,012 32,620 31,636 90,182 85,648 4,909 4,498 $ 138,354 $128,172 2,843,471 4,008 1,277 61,697 (1,350) (7,822) 324 (61,309) 64,614 11,797 61,439 11,797 ........... 6,493 6,493 (1,178) (1,178) 453 453 $17,565 BALANCE JUNE 30, 2010 Net earnings Other comprehensive income: Financial statement translation Hedges and investment securities, net of $711 tax Defined benefit retirement plans, net of $302 tax Total comprehensive income Dividends to shareholders: Common Preferred, net of tax benefits Treasury purchases Employee plan issuances Preferred stock conversions ESOP debt impacts Noncontrolling interest BALANCE JUNE 30, 2011 (112,729) 29,729 5,266 702 (5,534) (5,534) (233) (233) (7,039) (7,039) 1,033 1,735 37 38 31 37 37 $361 $(67,278) $70,682 $68,001 (43) 6 (7) 2,765,737 $4,008 $1,234 $62,405 $(1,357) $(2,054) 2011 2010 $ 8,022 $ 7,251 9,290 8,559 9,981 8,472 27,293 24,282 22,033 21,360 11,070 10,902 9,957 10,189 70,353 66,733 Liabilities and Shareholders' Equity CURRENT LIABILITIES Accounts payable Accrued and other liabilities Debt due within one year TOTAL CURRENT LIABILITIES LONG-TERM DEBT DEFERRED INCOME TAXES OTHER NONCURRENT LIABILITIES TOTAL LIABILITIES SHAREHOLDERS' EQUITY Convertible Class A preferred stock, stated value $1 per share (600 shares authorized) Non-Voting Class B preferred stock, stated value $1 per share (200 shares authorized) Common stock, stated value $1 per share (10,000 shares authorized; shares issued: 20114,007.9, 20104,007.6) Additional paid-in capital Reserve for ESOP debt retirement Accumulated other comprehensive income/loss) Treasury stock, at cost (shares held: 20111,242.2, 20101,164.1) Retained earnings Noncontrolling interest TOTAL SHAREHOLDERS' EQUITY TOTAL LIABILITIES AND SHAREHOLDERS' EQUITY 1,234 1,277 4,008 4,008 62,405 61,697 (1,357) (1,350) (2,054) (7,822) (67,278) (61,309) 70,682 64,614 ...... 361 324 68,001 61,439 $ 138,354 $128, 172 See accompanying Notes to Consolidated Financial Statements. Consolidated Balance Sheets 2011 2010 $ 2,768 $ 2,879 6,275 5,335 Amounts in millions, June 30 Assets CURRENT ASSETS Cash and cash equivalents Accounts receivable INVENTORIES Materials and supplies Work in process Finished goods Total inventories Deferred income taxes Prepaid expenses and other current assets TOTAL CURRENT ASSETS PROPERTY, PLANT AND EQUIPMENT Buildings and 2,153 717 4,509 7,379 1,140 4,408 21,970 1,692 604 4,088 6,384 990 3,194 18,782 6,868 29,294 Land 850 7,753 32,820 934 41,507 (20,214) 21,293 37,012 (17,768) 19,244 Total property, plant and equipment Accumulated depreciation NET PROPERTY, PLANT AND EQUIPMENT GOODWILL AND OTHER INTANGIBLE ASSETS Goodwill Trademarks and other intangible assets, net NET GOODWILL AND OTHER INTANGIBLE ASSETS OTHER NONCURRENT ASSETS TOTAL ASSETS 57,562 54,012 32,620 31,636 90,182 85,648 4,909 4,498 $ 138,354 $128,172 2,843,471 4,008 1,277 61,697 (1,350) (7,822) 324 (61,309) 64,614 11,797 61,439 11,797 ........... 6,493 6,493 (1,178) (1,178) 453 453 $17,565 BALANCE JUNE 30, 2010 Net earnings Other comprehensive income: Financial statement translation Hedges and investment securities, net of $711 tax Defined benefit retirement plans, net of $302 tax Total comprehensive income Dividends to shareholders: Common Preferred, net of tax benefits Treasury purchases Employee plan issuances Preferred stock conversions ESOP debt impacts Noncontrolling interest BALANCE JUNE 30, 2011 (112,729) 29,729 5,266 702 (5,534) (5,534) (233) (233) (7,039) (7,039) 1,033 1,735 37 38 31 37 37 $361 $(67,278) $70,682 $68,001 (43) 6 (7) 2,765,737 $4,008 $1,234 $62,405 $(1,357) $(2,054) 2011 2010 $ 8,022 $ 7,251 9,290 8,559 9,981 8,472 27,293 24,282 22,033 21,360 11,070 10,902 9,957 10,189 70,353 66,733 Liabilities and Shareholders' Equity CURRENT LIABILITIES Accounts payable Accrued and other liabilities Debt due within one year TOTAL CURRENT LIABILITIES LONG-TERM DEBT DEFERRED INCOME TAXES OTHER NONCURRENT LIABILITIES TOTAL LIABILITIES SHAREHOLDERS' EQUITY Convertible Class A preferred stock, stated value $1 per share (600 shares authorized) Non-Voting Class B preferred stock, stated value $1 per share (200 shares authorized) Common stock, stated value $1 per share (10,000 shares authorized; shares issued: 20114,007.9, 20104,007.6) Additional paid-in capital Reserve for ESOP debt retirement Accumulated other comprehensive income/loss) Treasury stock, at cost (shares held: 20111,242.2, 20101,164.1) Retained earnings Noncontrolling interest TOTAL SHAREHOLDERS' EQUITY TOTAL LIABILITIES AND SHAREHOLDERS' EQUITY 1,234 1,277 4,008 4,008 62,405 61,697 (1,357) (1,350) (2,054) (7,822) (67,278) (61,309) 70,682 64,614 ...... 361 324 68,001 61,439 $ 138,354 $128, 172 See accompanying Notes to Consolidated Financial Statements
Step by Step Solution
There are 3 Steps involved in it

Get step-by-step solutions from verified subject matter experts