

Question: Note: You can use help from software such as MS Excel to solve the forecasting method and MS project Management. The knowledge is refered to
Note: You can use help from software such as MS Excel to solve the forecasting method and MS project Management.
Walmart Sales Data Time Period all 1 2 3 4 Year Quarter 2016 Quarter 1 Quarter 2 Quarter 3 Quarter 4 2017 Quarter 1 Quarter 2 Quarter 3 Quarter 4 2018 Quarter 1 Quarter 2 Quarter 3 Quarter 4 2019 Quarter 1 Quarter 2 Quarter 3 Quarter 4 2020 Quarter 1 Quarter 2 Quarter 3 Quarter 4 2021 Quarter 1 5 6 7 8 9 10 11 12 13 14 15 16 17 18 19 20 21 Sales Data (S) 25409 28366 28777 35386 29819 33521 33509 40785 34717 38170 40432 51394 42985 46112 45676 56556 48565 53269 51754 64211 091919 A. Plot the time chart. Is there any sign of trend, seasonality, irregularity in the time chart? (1 Mark) B. Conduct a 3 Period Moving Average Forecasting Method showing all forecast values up to 2021 Quarter1. (2 Marks) C. Conduct a 3 Period Weighted Moving Average Forecasting Method showing all forecast values up to 2021 Quarter 1. Weights are 0.45, 0.325, and 0.225. (2 Marks) D. Conduct forecast using exponential smoothing with alpha value 0.25 and forecast all values up to 2021 Quarter 1. Start your forecast from 2nd time period (i.e., Quarter 2, year 2016) assuming the first forecast method is a nave method. (2 Marks) E. Calculate MAPE and MSE for each method above. Based on MAPE, which method is a good model? Based on MSE, which forecast method is a good model? (4 Marks) The knowledge is refered to Supply Chain Management 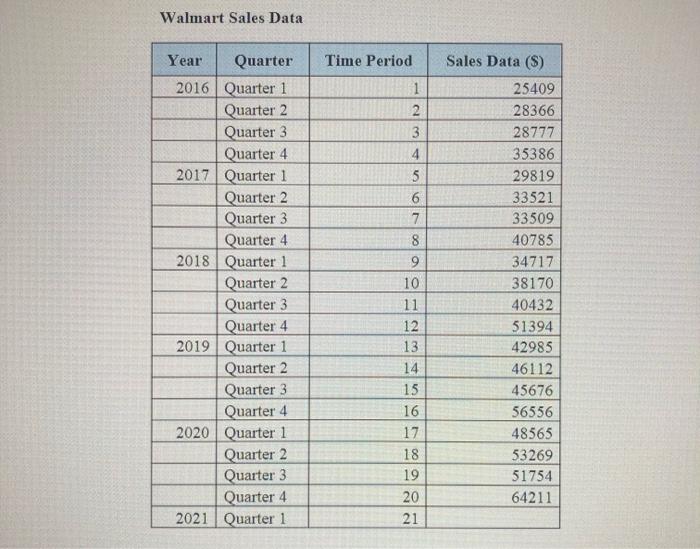
Step by Step Solution
There are 3 Steps involved in it
1 Expert Approved Answer
Step: 1 Unlock

Question Has Been Solved by an Expert!
Get step-by-step solutions from verified subject matter experts
Step: 2 Unlock
Step: 3 Unlock