

Question: Note:attachments are not allowed, you should write your answers in the response text area, write the number of each question branch before answering it ,
Note:attachments are not allowed, you should write your answers in the response text area, write the number of each question branch before answering it I will not check any code without the question branch number.
Question:
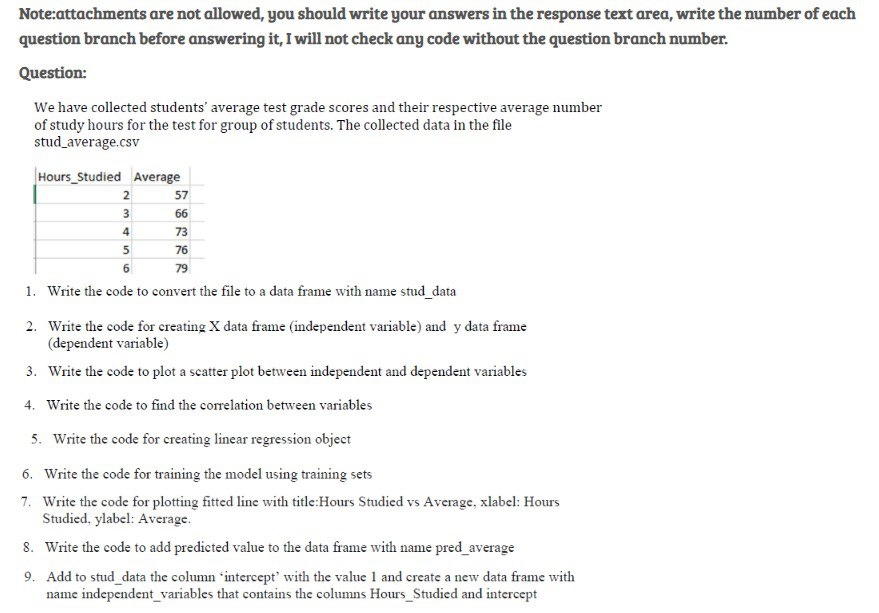
We have collected students' average test grade scores and their respective average number of study hours for the test for group of students. The collected data in the file studaverage.csv
tableHoursStudied,Average
Write the code to convert the file to a data frame with name studdata
Write the code for creating data frame independent variable and data frame dependent variable
Write the code to plot a scatter plot between independent and dependent variables
Write the code to find the correlation between variables
Write the code for creating linear regression object
Write the code for training the model using training sets
Write the code for plotting fitted line with title:Hours Studied vs Average, xlabel: Hours Studied, ylabel: Average.
Write the code to add predicted value to the data frame with name predaverage
Add to studdata the column 'intercept' with the value and create a new data frame with name independentvariables that contains the columns HoursStudied and intercept
Step by Step Solution
There are 3 Steps involved in it
1 Expert Approved Answer
Step: 1 Unlock

Question Has Been Solved by an Expert!
Get step-by-step solutions from verified subject matter experts
Step: 2 Unlock
Step: 3 Unlock