

Question: Now evaluate your data and interpret the results. Answer the following questions in a document. What is Pearson's r that you calculated, and what does
Now evaluate your data and interpret the results. Answer the following questions in a document.
- What is Pearson's r that you calculated, and what does it tell us?
- What is the r2that you calculated, and what does it tell us?
- Is this a good model for prediction? Why or why not?
- Is there a relationship between altitude and altimeter error?
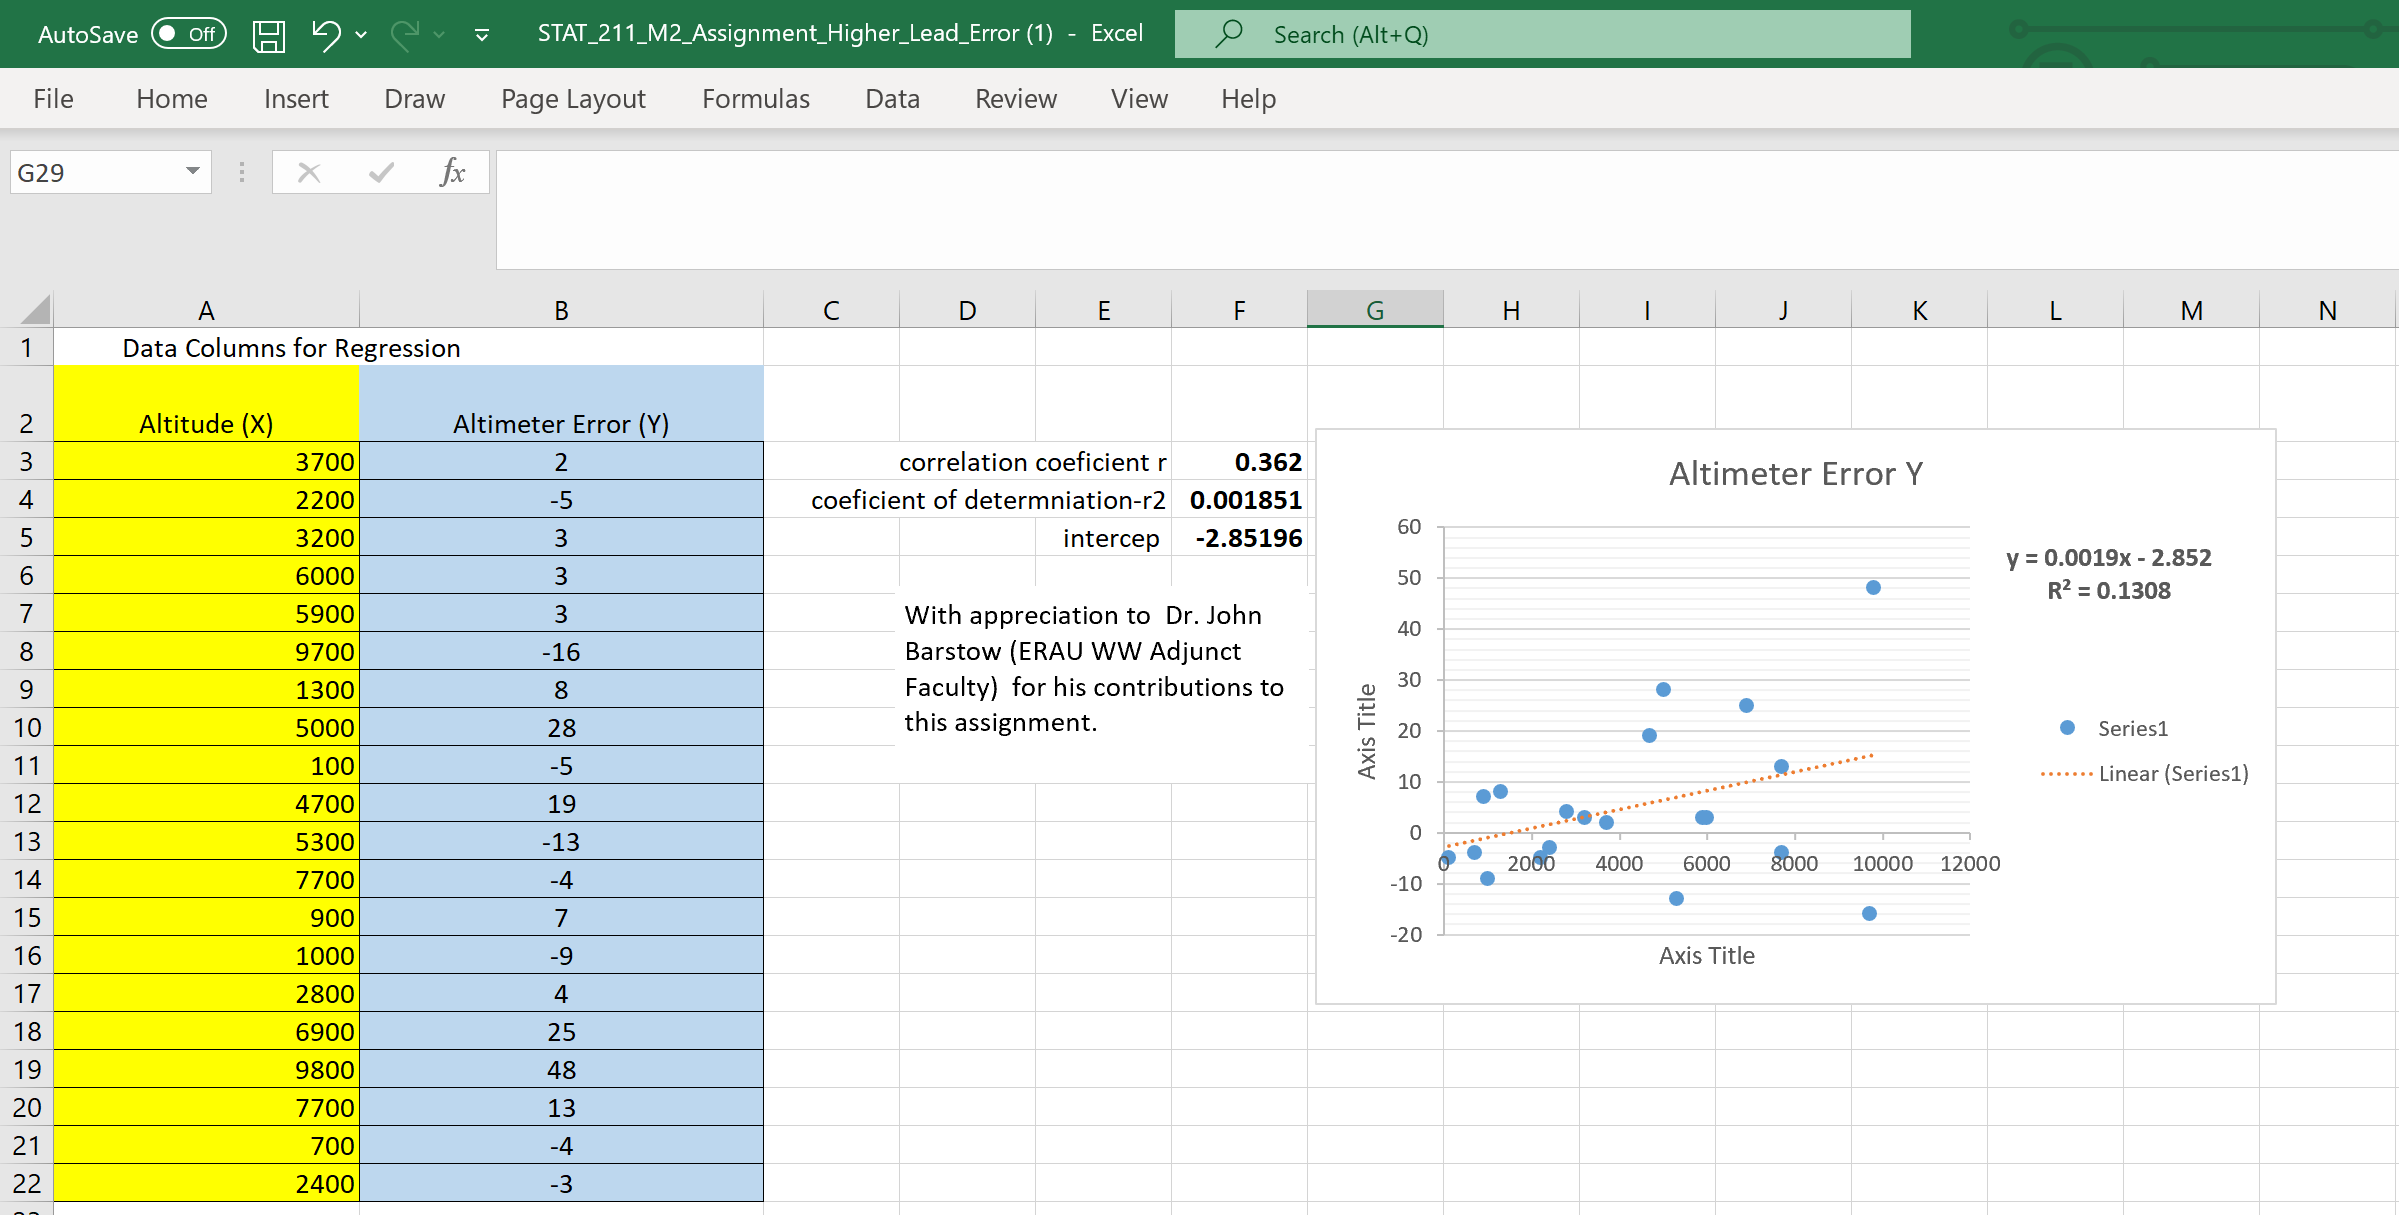
AutoSave O Off STAT_211_M2_Assignment_Higher_Lead_Error (1) - Excel O Search (Alt+Q) File Home Insert Draw Page Layout Formulas Data Review View Help G29 X V fx A B C D E F G H K L M N Data Columns for Regression Altitude (X) Altimeter Error (Y) 3700 2 correlation coeficient r 0.362 Altimeter Error Y 2200 -5 coeficient of determniation-r2 0.001851 3200 3 intercep -2.85196 60 y = 0.0019x - 2.852 6000 3 50 R2 = 0.1308 5900 3 With appreciation to Dr. John 40 A W N J O L O V O UT A W N 9700 -16 Barstow (ERAU WW Adjunct 1300 8 Faculty) for his contributions to 30 5000 28 this assignment. Axis Title 20 Series1 100 -5 . . . . . ........ 10 ... . . .. Linear (Series1) 4700 19 5300 -13 0 . . . . . . . .. . . . . .. . " 2000 4000 6000 8000 10000 12000 7700 -4 -10 15 900 7 -20 1000 -9 Axis Title 17 2800 4 18 6900 25 19 9800 48 20 7700 13 21 700 -4 22 2400 -3
Step by Step Solution
There are 3 Steps involved in it

Get step-by-step solutions from verified subject matter experts