

Question: - Now it is time to do some relative analysis using Z-scores with the assumption of a normal distribution curve. Use the analysis products from
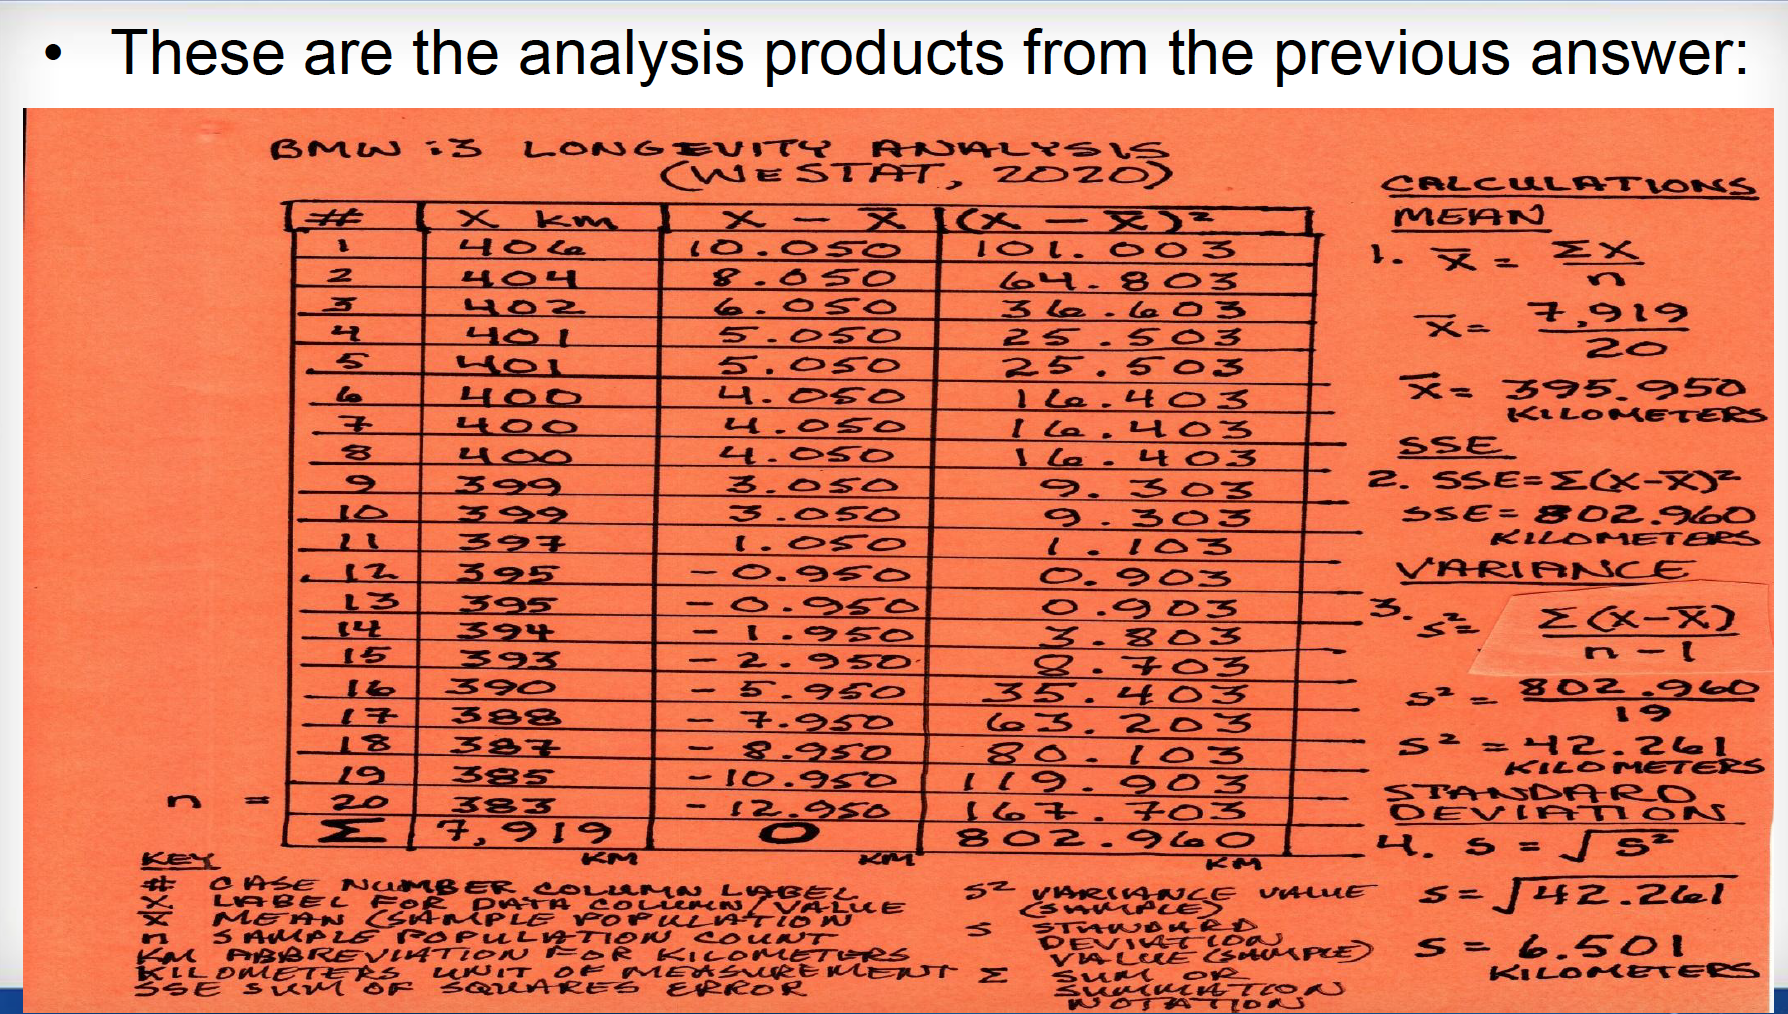
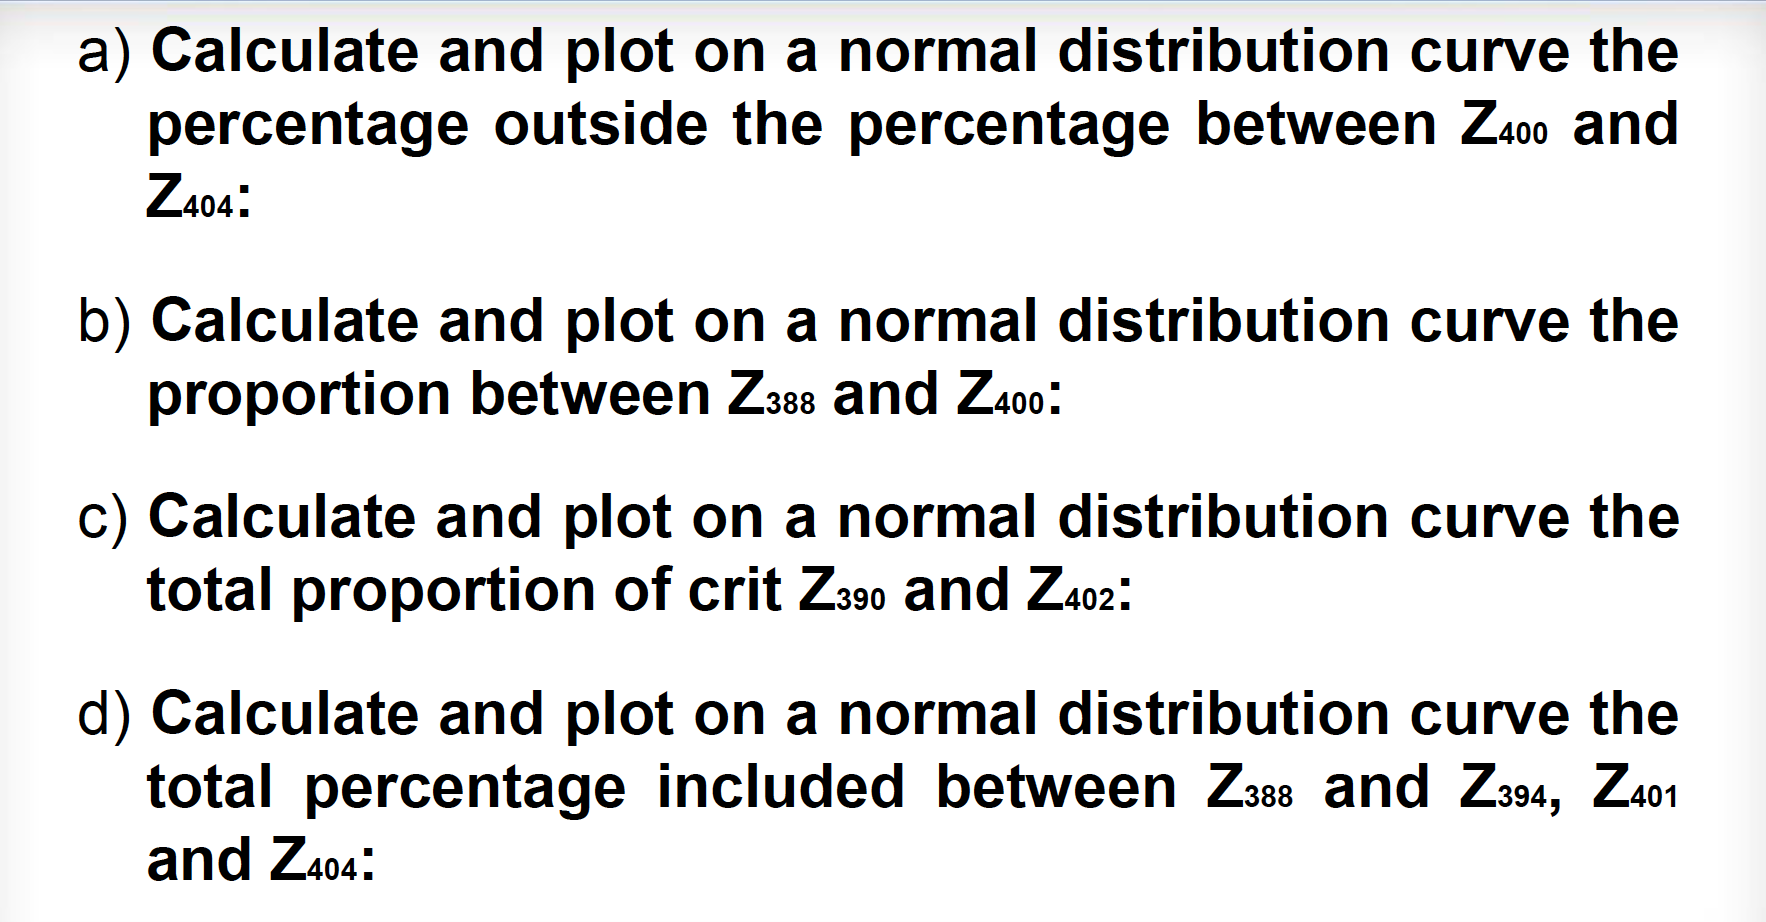
- Now it is time to do some relative analysis using Z-scores with the assumption of a normal distribution curve. Use the analysis products from the previous answer to provide the information necessary for the following Z-scores. Do not forget to plot these Z-scores and calculation products on a fully labeled, normal distribution curve. Full sentence answers required. \fa) Calculate and plot on a normal distribution curve the percentage outside the percentage between 2400 and 24042 b) Calculate and plot on a normal distribution curve the proportion between Z388 and 24002 c) Calculate and plot on a normal distribution curve the total proportion of crit Z390 and Z402: d) Calculate and plot on a normal distribution curve the total percentage included between 2388 and 2394, 2m and 24042
Step by Step Solution
There are 3 Steps involved in it

Get step-by-step solutions from verified subject matter experts