

Question: Now lets look at yield ratios and cost-per hire data for several different recruitment sources. By looking at recruiting data in an organized way, you
Now lets look at yield ratios and cost-per hire data for several different recruitment sources. By looking at recruiting data in an organized way, you can analyze the cost and effectiveness of your recruiting sources.
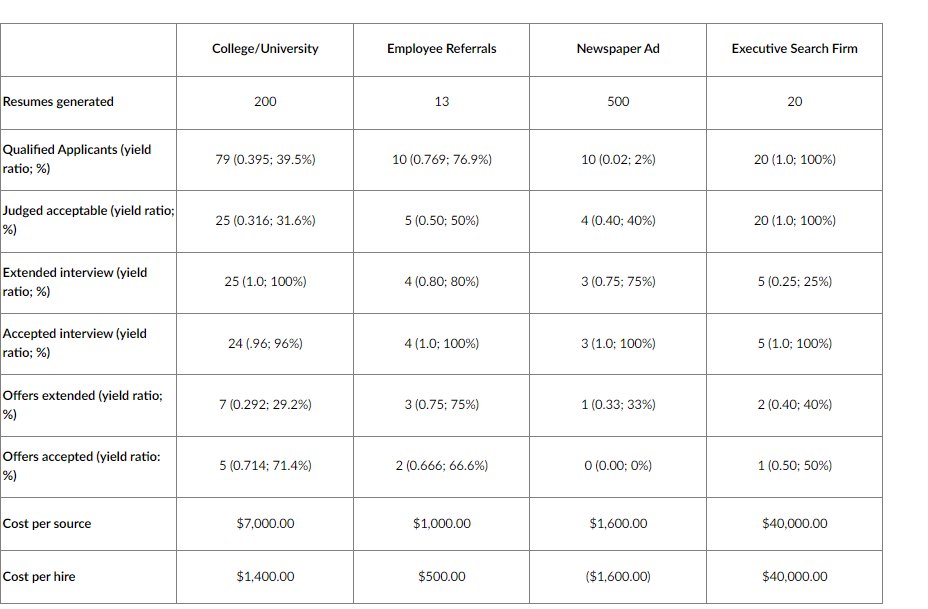
Your are a HR Manager tasked with providing an analysis to the company's executive board on your recruiting sources. You have compiled the below information. Review the information in the chart below. Provide a 200-word (minimum) analysis about your observations based on the data provided. You will be asked for recommendations by the board based on your data review. Your analysis will be presented at the next executive board meeting and you want to have a positive impact for future promotion. Be sure to address each category in your analysis.
College/University Employee Referrals Newspaper Ad Executive Search Firm Resumes generated 200 13 500 20 Qualified Applicants (yield ratio; %) 79 (0.395; 39.5%) 10 (0.769; 76.9%) 10 (0.02:2%) 20 (1.0; 100%) Judged acceptable (yield ratio; %) 25 (0.316; 31.6%) 5 (0.50; 50%) 4(0.40; 40%) 20 (1.0; 100%) Extended interview (yield ratio; %) 25 (1.0; 100%) 4 (0.80; 80%) 3 (0.75; 75%) 5 (0.25; 25%) Accepted interview (yield ratio; %) 24 (-96; 96%) 4(1.0; 100%) 3(1.0; 100%) 5 (1.0; 100%) Offers extended (yield ratio; %) 7 (0.292; 29.2%) 3 (0.75; 75%) 1 (0.33; 33%) 2 (0.40; 40%) Offers accepted (yield ratio: %) 5 (0.714; 71.4%) 2 (0.666; 66.6%) 0 (0.00; 0%) 1 (0.50: 50%) Cost per source $7,000.00 $1,000.00 $1,600.00 $40,000.00 Cost per hire $1,400.00 $500.00 ($1,600.00) $40,000.00
Step by Step Solution
There are 3 Steps involved in it

Get step-by-step solutions from verified subject matter experts