

Question: Now, let's simulate the sampling distribution of sample average by resampling from the population many many times (say 10,000 times). In the Java App: Biock
Now, let's simulate the sampling distribution of sample average by resampling from the population many many times (say 10,000 times).
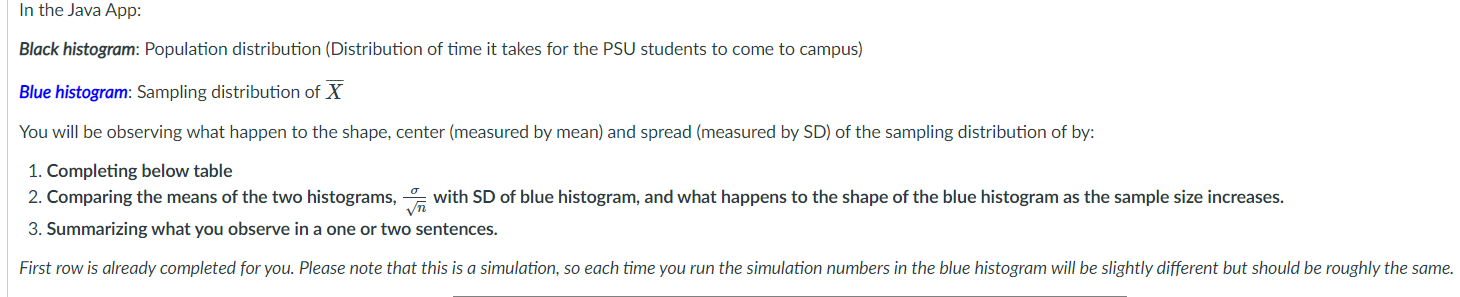
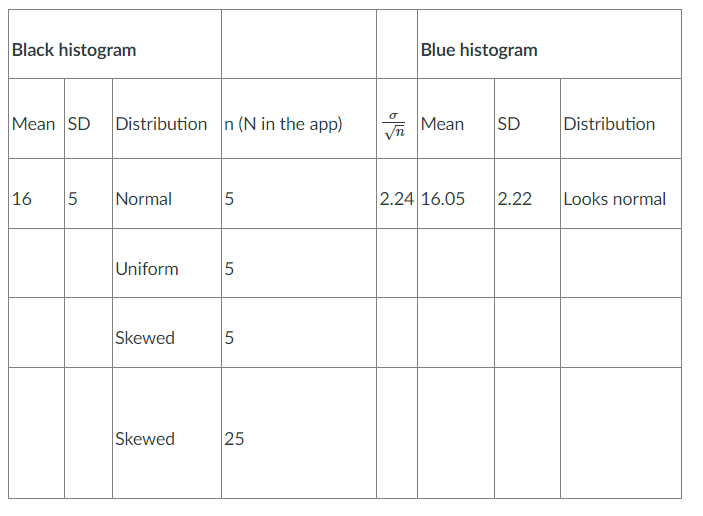
In the Java App: Biock histogram: Population distribution (Distribution of time it takes for the PSU students to come to campus) Biue histogram: Sampling distribution of )7 You will be observing what happen to the shape, center (measured by mean) and spread (measured by SD) ofthe sampling distribution of by: 1. Completing below table 2. Comparing the means of the two histograms. % with SD of blue histogram. and what happens to the shape of the blue histogram as the sample size increases. 3. Summarizing what you observe in a one or two sentences. First row is already completed for you. Please note that this is a simulation, so each time you run the simulation numbers in the blue histogram will be slightly different but should be roughly the same. Black histogram Blue histogram Distribution n (N in the app) Distribution Looks normal Skewed 25
Step by Step Solution
There are 3 Steps involved in it

Get step-by-step solutions from verified subject matter experts