

Question: now take a look at the data. 1. Current ratio 2. Days' inventory outstanding (DIO) - (hint: both companies use the wording 'Cost of sales'
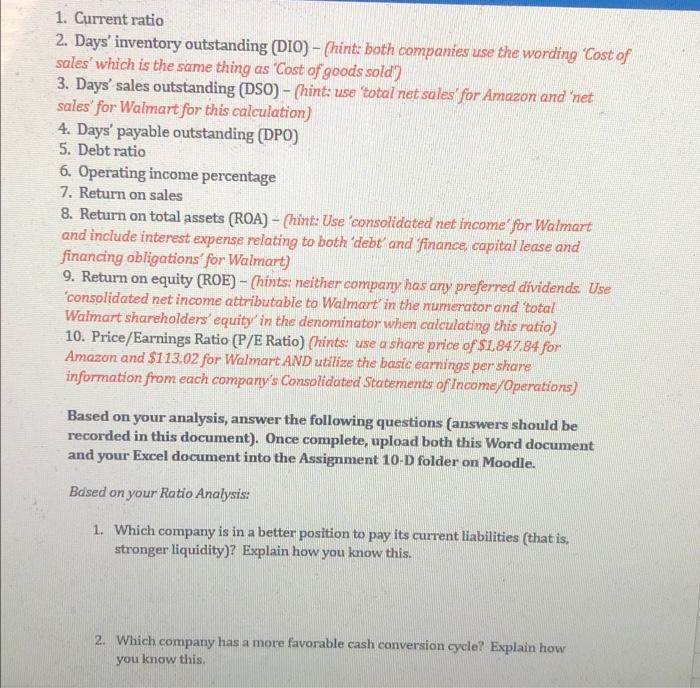
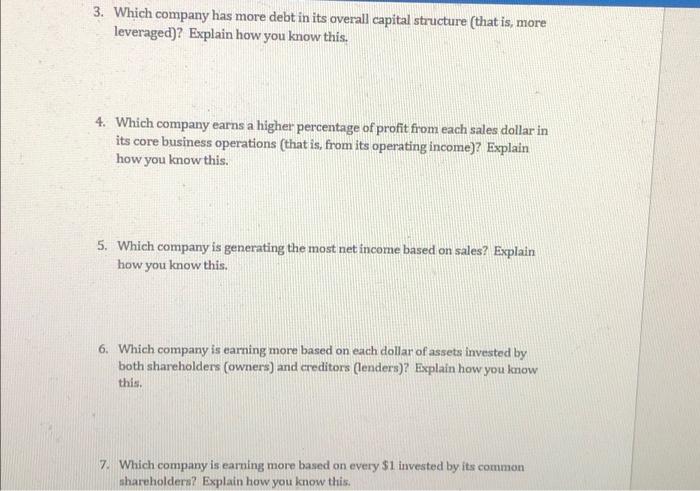
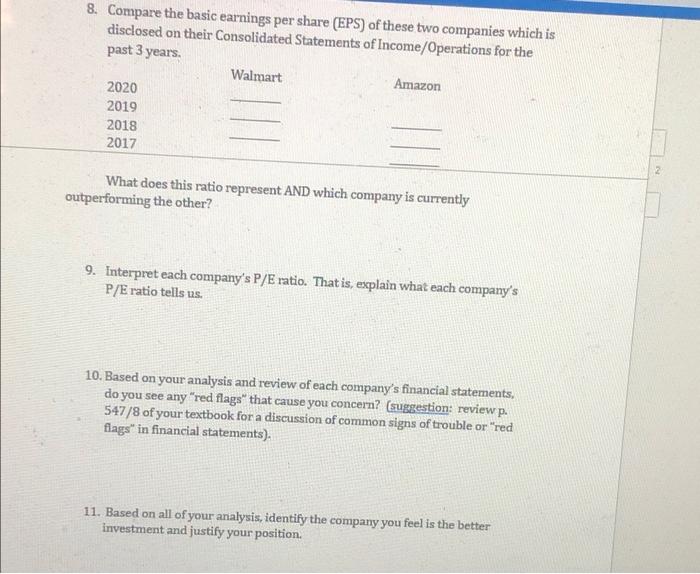

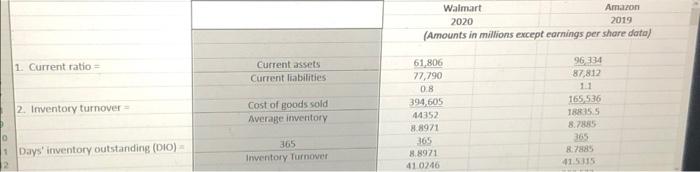
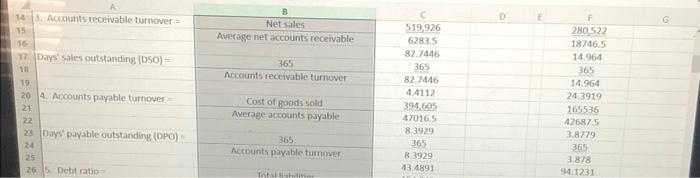
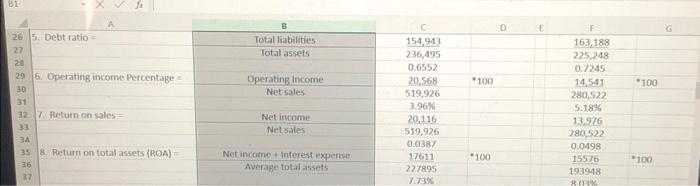
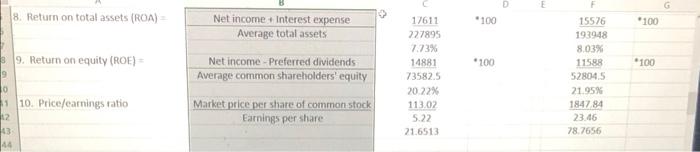
1. Current ratio 2. Days' inventory outstanding (DIO) - (hint: both companies use the wording 'Cost of sales' which is the same thing as 'Cost of goods sold) 3. Days' sales outstanding (DSO) - (hint: use total net sales' for Amazon and 'net sales' for Walmart for this calculation) 4. Days' payable outstanding (DPO) 5. Debt ratio 6. Operating income percentage 7. Return on sales 8. Return on total assets (ROA) - (hint: Use 'consolidated net income for Walmart and include interest expense relating to both debt and finance, capital lease and financing obligations' for Walmart) 9. Return on equity (ROE) - (hints: neither company has any preferred dividends. Use 'consolidated net income attributable to Walmart in the numerator and total Walmart shareholders' equity in the denominator when calculating this ratio) 10. Price/Earnings Ratio (P/E Ratio) (hints: use a share price of $1,847.84 for Amazon and $113,02 for Walmart AND utilize the basic earnings per share information from each company's Consolidated Statements of Income/Operations) Based on your analysis, answer the following questions (answers should be recorded in this document). Once complete, upload both this Word document and your Excel document into the Assignment 10-D folder on Moodle. Based on your Ratio Analysis: 1. Which company is in a better position to pay its current liabilities (that is, stronger liquidity)? Explain how you know this. 2. Which company has a more fave you know this. able cash conversion cycle? Explain how 3. Which company has more debt in its overall capital structure that is, more leveraged)? Explain how you know this. 4. Which company earns a higher percentage of profit from each sales dollar in its core business operations (that is, from its operating income)? Explain how you know this. 5. Which company is generating the most net income based on sales? Explain how you know this. 6. Which company is earning more based on each dollar of assets invested by both shareholders (owners) and creditors (lenders)? Explain how you know this. 7. Which company is earning more based on every $1 invested by its common shareholders? Explain how you know this. 8. Compare the basic earnings per share (EPS) of these two companies which is disclosed on their Consolidated Statements of Income/Operations for the past 3 years Walmart Amazon 2020 2019 2018 2017 2 What does this ratio represent AND which company is currently outperforming the other? 9. Interpret each company's P/E ratio. That is, explain what each company's P/Eratio tells us. 10. Based on your analysis and review of each company's financial statements, do you see any "red flags" that cause you concern? (suggestion: review p. 547/8 of your textbook for a discussion of common signs of trouble or "red flags" in financial statements). 11. Based on all of your analysis, identify the company you feel is the better investment and justify your position. 12. If you could ask Doug McMillon, the CEO of Walmart one question so that you can made a better informed investment decision, what would that question be? 13. If you could ask Jeffrey Bezos, the CEO of Amazon one question so that you could make a better informed investment decision, what would that question be? 14. Identify at least one limitation with respect to the ratio analysis you performed on this assignment. (suggestion: review p. 547 of your textbook for a discussion of possible limitations Walmart Amaron 2020 2019 (Amounts in millions except cornings per share data) 1. Current ratio = Current assets Current liabilities 61,806 77,790 96334 87,812 0.8 2. Inventory turnover Cost of goods sold Average inventory 394,605 44352 8.8971 365 88971 41 0246 165536 1885.5 8.75 365 8.7889 41.535 0 Days' inventory outstanding (10) 365 Inventory Turnover D 14. Accounts receivable turnover = 15 16 17 Days' sales outstanding (050) = B Net sales Average net accounts receivable 365 Accounts receivable turnover 519.926 6283.5 82.7446 365 82.7446 4.4112 394.605 47016,5 8,3929 365 8.3929 43.4891 19 204 Accounts payable turnover 21 22 23 Days' payable outstanding (DPO) 24 25 265 Debt ratio Cost of goods sold Average accounts payable 280,522 18746.5 14.964 365 14.964 243919 165536 426875 3.8779 365 3.878 941231 365 Accounts payable tumover Til D E Total liabilities Total assets Operating Income Net sales *100 31 s A 26 5. Debt ratio = 27 28 29 6. Operating income Percentage 30 31 12 7 Return on sales 33 34 35 8. Return on total assets (ROA) - 26 37 *100 154.943 236,495 0.6552 20.568 519,926 3.96% 20.116 519,926 0.0387 17511 227895 2.73% 163,188 225,248 0.7245 14,541 280,522 5.18% 13,976 280,522 0.0498 15576 193948 RE Net income Net sales Net income interest expense Average total assets *100 "100 G 8. Return on total assets (ROA) *100 "100 Net income + Interest expense Average total assets 9. Return on equity (ROE) = * 100 *100 9 0 Net income-Preferred dividends Average common shareholders' equity 17611 227895 7.73% 14881 73582.5 20.22% 113.02 5.22 21.6513 15576 193948 8.03% 11588 528045 21.95% 1847 84 23.46 78.7656 10. Price/earnings ratio Market price per share of common stock Earnings per share 12 13 44
Step by Step Solution
There are 3 Steps involved in it

Get step-by-step solutions from verified subject matter experts