

Question: Now that you have your two solutions for the two guesses, plot the solution against the data that you have. Assume that you have access
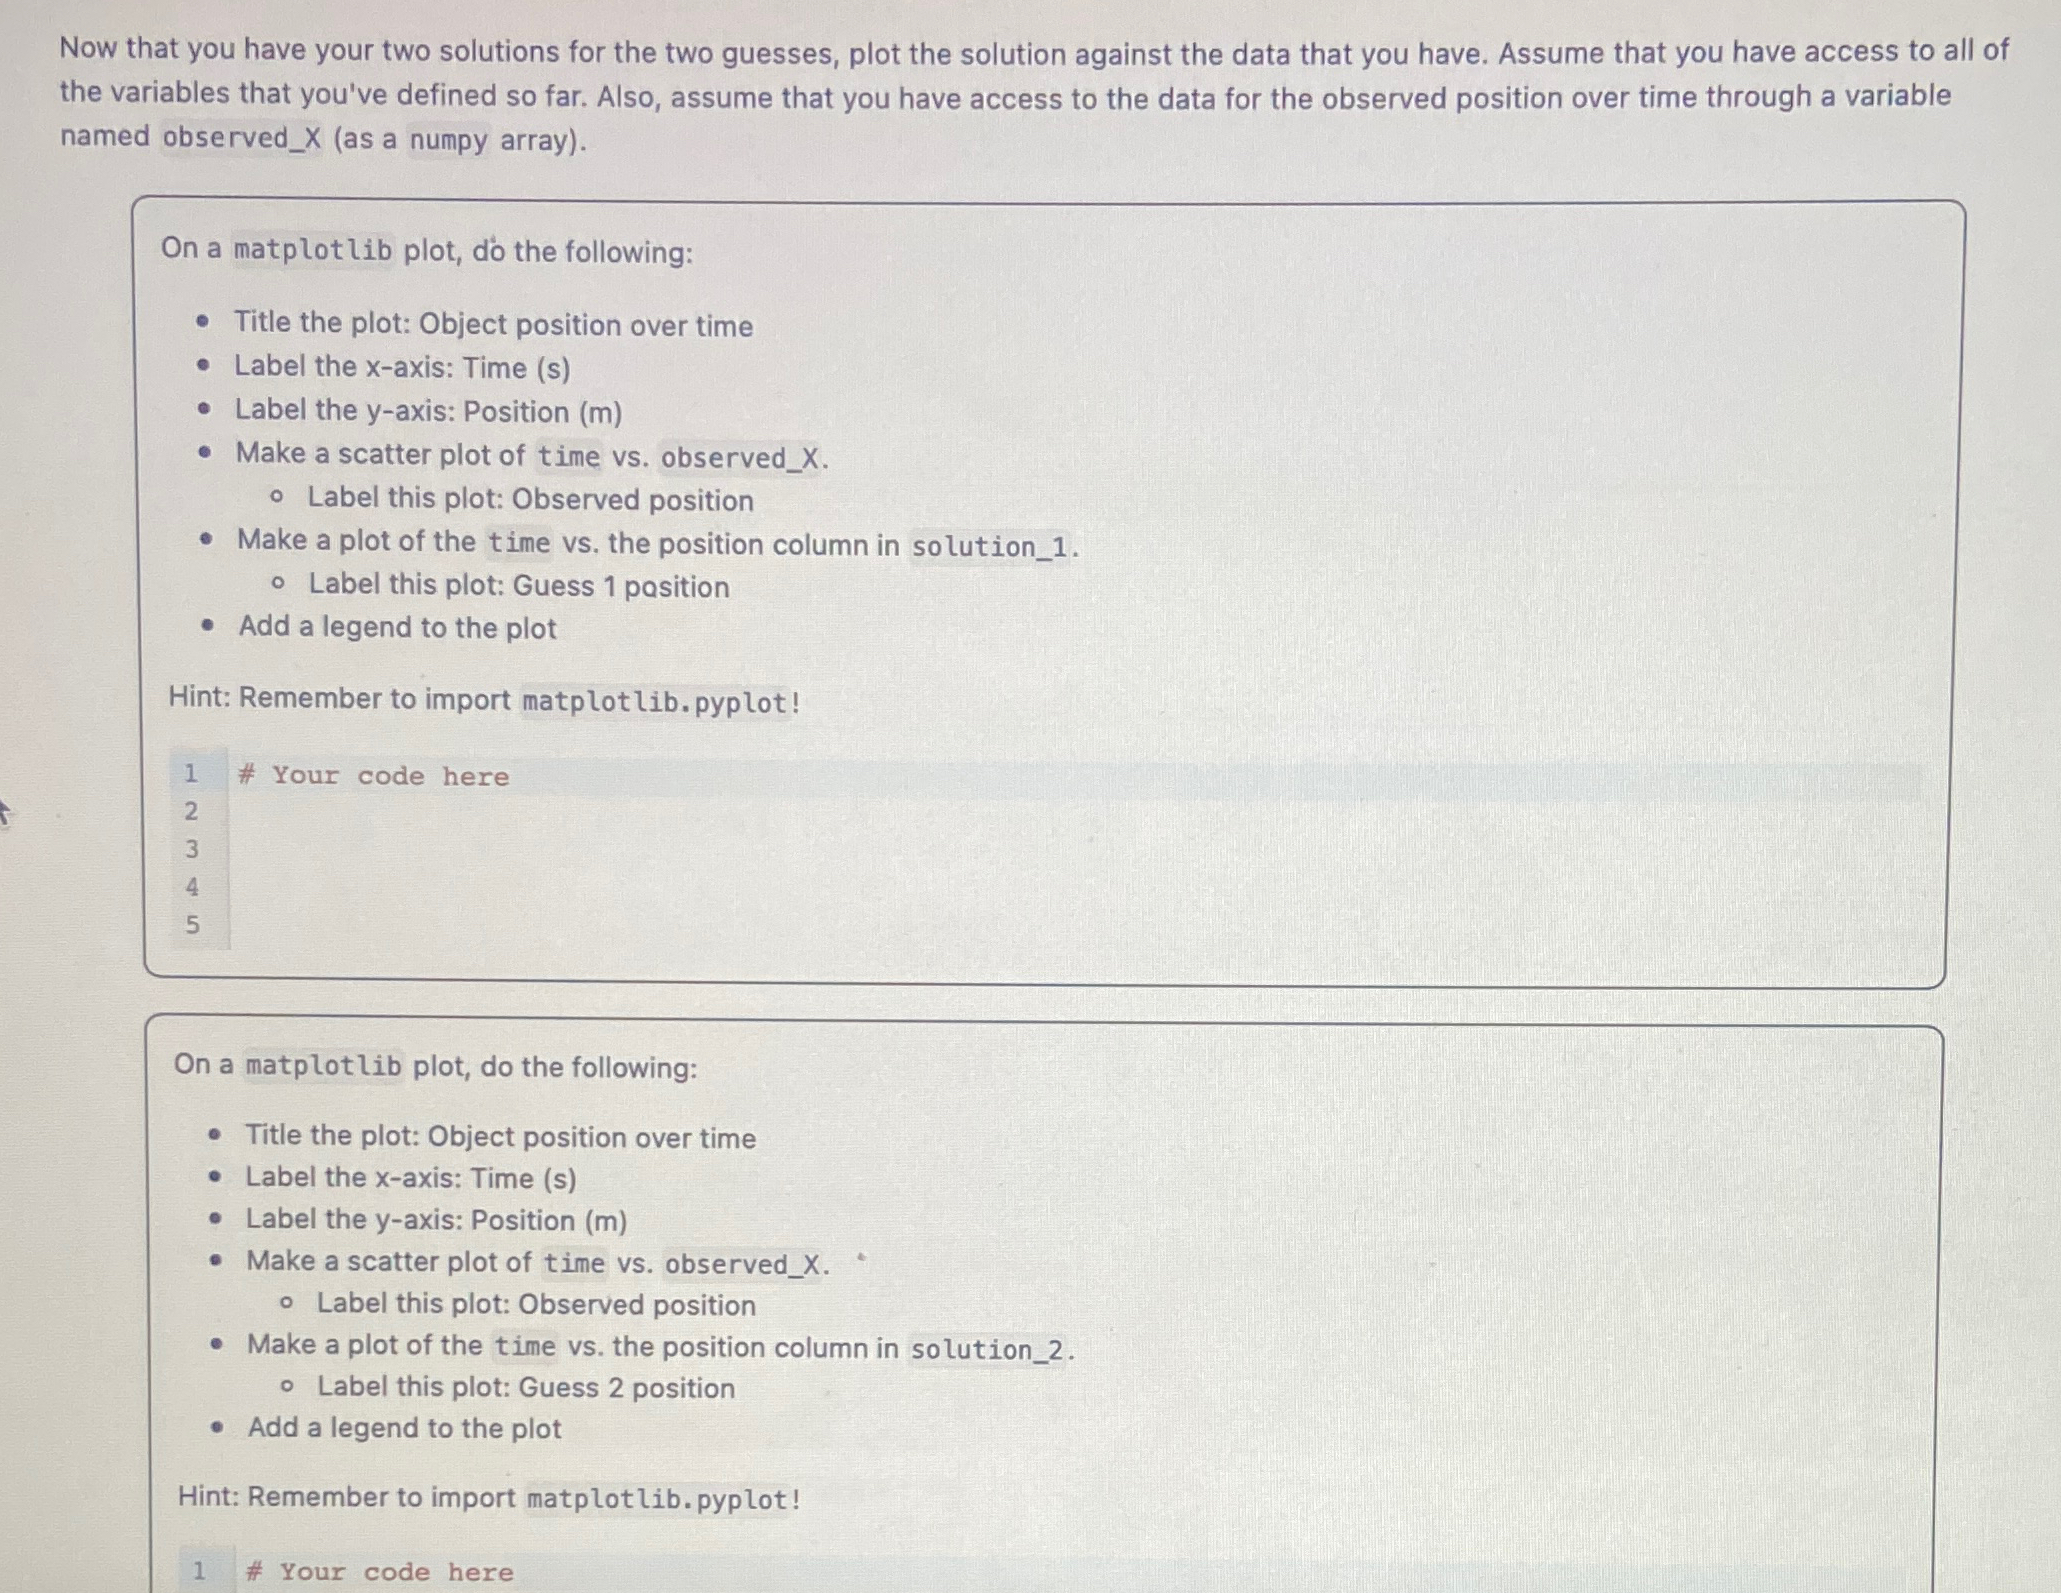
Now that you have your two solutions for the two guesses, plot the solution against the data that you have. Assume that you have access to all of the variables that you've defined so far. Also, assume that you have access to the data for the observed position over time through a variable named observedX as a numpy array
On a matplot lib plot, do the following:
Title the plot: Object position over time
Label the xaxis: Time s
Label the axis: Position m
Make a scatter plot of time vs observedX
Label this plot: Observed position
Make a plot of the time vs the position column in solution
Label this plot: Guess pasition
Add a legend to the plot
Hint: Remember to import matplot lib.pyplot!
On a matplot lib plot, do the following:
Title the plot: Object position over time
Label the axis: Time s
Label the axis: Position m
Make a scatter plot of time vs observedX
Label this plot: Observed position
Make a plot of the time vs the position column in solution
Label this plot: Guess position
Add a legend to the plot
Hint: Remember to import matplotlib. pyplot
# Your code here
Step by Step Solution
There are 3 Steps involved in it
1 Expert Approved Answer
Step: 1 Unlock

Question Has Been Solved by an Expert!
Get step-by-step solutions from verified subject matter experts
Step: 2 Unlock
Step: 3 Unlock