

Question: Now that you've learned about hypothesis testing and p-values, you should also be aware that these methods can be used incorrectly. Or, even worse,
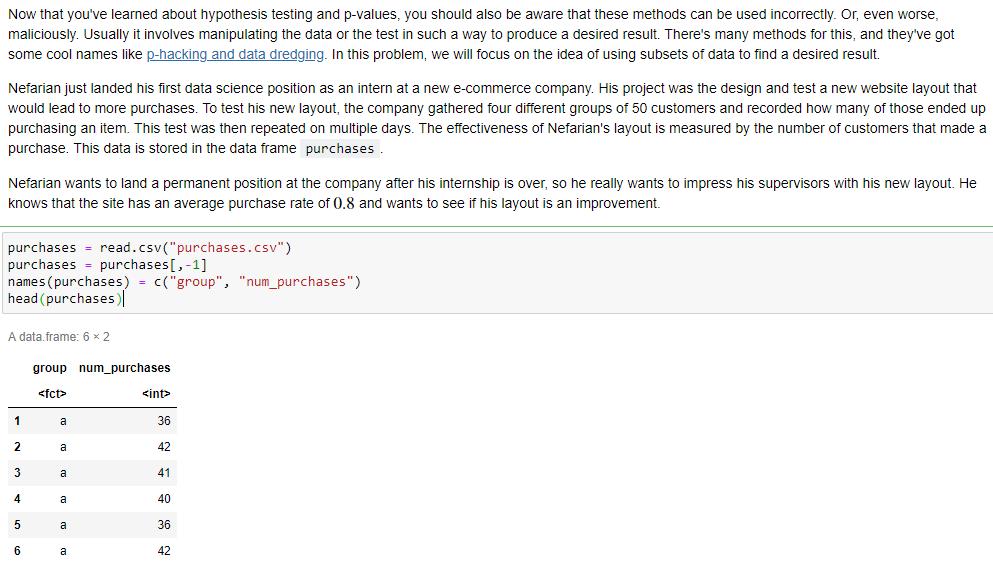
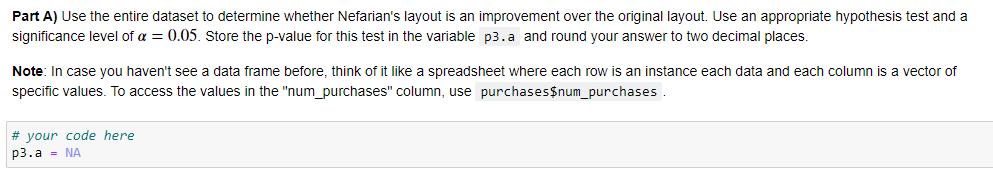
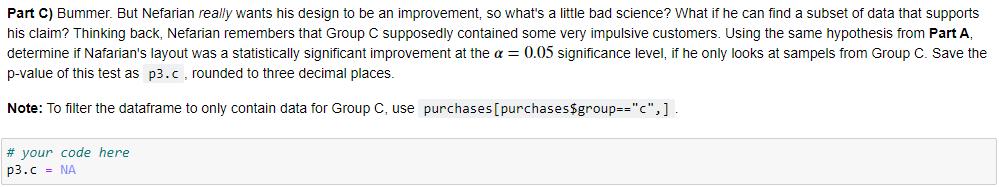
Now that you've learned about hypothesis testing and p-values, you should also be aware that these methods can be used incorrectly. Or, even worse, maliciously. Usually it involves manipulating the data or the test in such a way to produce a desired result. There's many methods for this, and they've got some cool names like p-hacking and data dredging. In this problem, we will focus on the idea of using subsets of data to find a desired result. Nefarian just landed his first data science position as an intern at a new e-commerce company. His project was the design and test a new website layout that would lead to more purchases. To test his new layout, the company gathered four different groups of 50 customers and recorded how many of those ended up purchasing an item. This test was then repeated on multiple days. The effectiveness of Nefarian's layout is measured by the number of customers that made a purchase. This data is stored in the data frame purchases. Nefarian wants to land a permanent position at the company after his internship is over, so he really wants to impress his supervisors with his new layout. He knows that the site has an average purchase rate of 0.8 and wants to see if his layout is an improvement. purchases purchases = purchases[,-1] names (purchases) = c("group", "num_purchases") head (purchases)| read.csv("purchases.csv") A data.frame: 6 x 2 group num_purchases a 36 2 a 42 a 41 a 40 a 36 a 42 Part A) Use the entire dataset to determine whether Nefarian's layout is an improvement over the original layout. Use an appropriate hypothesis test and a significance level of a = 0.05. Store the p-value for this test in the variable p3.a and round your answer to two decimal places. Note: In case you haven't see a data frame before, think of it like a spreadsheet where each row is an instance each data and each column is a vector of specific values. To access the values in the "num_purchases" column, use purchases$num_purchases . # your code here p3.a = NA Part C) Bummer. But Nefarian really wants his design to be an improvement, so what's a little bad science? What if he can find a subset of data that supports his claim? Thinking back, Nefarian remembers that Group C supposedly contained some very impulsive customers. Using the same hypothesis from Part A, determine if Nafarian's layout was a statistically significant improvement at the a = 0.05 significance level, if he only looks at sampels from Group C. Save the p-value of this test as p3.c, rounded to three decimal places. Note: To filter the dataframe to only contain data for Group C, use purchases[purchases$group=="c",]. # your code here p3.c = NA Now that you've learned about hypothesis testing and p-values, you should also be aware that these methods can be used incorrectly. Or, even worse, maliciously. Usually it involves manipulating the data or the test in such a way to produce a desired result. There's many methods for this, and they've got some cool names like p-hacking and data dredging. In this problem, we will focus on the idea of using subsets of data to find a desired result. Nefarian just landed his first data science position as an intern at a new e-commerce company. His project was the design and test a new website layout that would lead to more purchases. To test his new layout, the company gathered four different groups of 50 customers and recorded how many of those ended up purchasing an item. This test was then repeated on multiple days. The effectiveness of Nefarian's layout is measured by the number of customers that made a purchase. This data is stored in the data frame purchases. Nefarian wants to land a permanent position at the company after his internship is over, so he really wants to impress his supervisors with his new layout. He knows that the site has an average purchase rate of 0.8 and wants to see if his layout is an improvement. purchases purchases = purchases[,-1] names (purchases) = c("group", "num_purchases") head (purchases)| read.csv("purchases.csv") A data.frame: 6 x 2 group num_purchases a 36 2 a 42 a 41 a 40 a 36 a 42 Part A) Use the entire dataset to determine whether Nefarian's layout is an improvement over the original layout. Use an appropriate hypothesis test and a significance level of a = 0.05. Store the p-value for this test in the variable p3.a and round your answer to two decimal places. Note: In case you haven't see a data frame before, think of it like a spreadsheet where each row is an instance each data and each column is a vector of specific values. To access the values in the "num_purchases" column, use purchases$num_purchases . # your code here p3.a = NA Part C) Bummer. But Nefarian really wants his design to be an improvement, so what's a little bad science? What if he can find a subset of data that supports his claim? Thinking back, Nefarian remembers that Group C supposedly contained some very impulsive customers. Using the same hypothesis from Part A, determine if Nafarian's layout was a statistically significant improvement at the a = 0.05 significance level, if he only looks at sampels from Group C. Save the p-value of this test as p3.c, rounded to three decimal places. Note: To filter the dataframe to only contain data for Group C, use purchases[purchases$group=="c",]. # your code here p3.c = NA Now that you've learned about hypothesis testing and p-values, you should also be aware that these methods can be used incorrectly. Or, even worse, maliciously. Usually it involves manipulating the data or the test in such a way to produce a desired result. There's many methods for this, and they've got some cool names like p-hacking and data dredging. In this problem, we will focus on the idea of using subsets of data to find a desired result. Nefarian just landed his first data science position as an intern at a new e-commerce company. His project was the design and test a new website layout that would lead to more purchases. To test his new layout, the company gathered four different groups of 50 customers and recorded how many of those ended up purchasing an item. This test was then repeated on multiple days. The effectiveness of Nefarian's layout is measured by the number of customers that made a purchase. This data is stored in the data frame purchases. Nefarian wants to land a permanent position at the company after his internship is over, so he really wants to impress his supervisors with his new layout. He knows that the site has an average purchase rate of 0.8 and wants to see if his layout is an improvement. purchases purchases = purchases[,-1] names (purchases) = c("group", "num_purchases") head (purchases)| read.csv("purchases.csv") A data.frame: 6 x 2 group num_purchases a 36 2 a 42 a 41 a 40 a 36 a 42 Part A) Use the entire dataset to determine whether Nefarian's layout is an improvement over the original layout. Use an appropriate hypothesis test and a significance level of a = 0.05. Store the p-value for this test in the variable p3.a and round your answer to two decimal places. Note: In case you haven't see a data frame before, think of it like a spreadsheet where each row is an instance each data and each column is a vector of specific values. To access the values in the "num_purchases" column, use purchases$num_purchases . # your code here p3.a = NA Part C) Bummer. But Nefarian really wants his design to be an improvement, so what's a little bad science? What if he can find a subset of data that supports his claim? Thinking back, Nefarian remembers that Group C supposedly contained some very impulsive customers. Using the same hypothesis from Part A, determine if Nafarian's layout was a statistically significant improvement at the a = 0.05 significance level, if he only looks at sampels from Group C. Save the p-value of this test as p3.c, rounded to three decimal places. Note: To filter the dataframe to only contain data for Group C, use purchases[purchases$group=="c",]. # your code here p3.c = NA Now that you've learned about hypothesis testing and p-values, you should also be aware that these methods can be used incorrectly. Or, even worse, maliciously. Usually it involves manipulating the data or the test in such a way to produce a desired result. There's many methods for this, and they've got some cool names like p-hacking and data dredging. In this problem, we will focus on the idea of using subsets of data to find a desired result. Nefarian just landed his first data science position as an intern at a new e-commerce company. His project was the design and test a new website layout that would lead to more purchases. To test his new layout, the company gathered four different groups of 50 customers and recorded how many of those ended up purchasing an item. This test was then repeated on multiple days. The effectiveness of Nefarian's layout is measured by the number of customers that made a purchase. This data is stored in the data frame purchases. Nefarian wants to land a permanent position at the company after his internship is over, so he really wants to impress his supervisors with his new layout. He knows that the site has an average purchase rate of 0.8 and wants to see if his layout is an improvement. purchases purchases = purchases[,-1] names (purchases) = c("group", "num_purchases") head (purchases)| read.csv("purchases.csv") A data.frame: 6 x 2 group num_purchases a 36 2 a 42 a 41 a 40 a 36 a 42 Part A) Use the entire dataset to determine whether Nefarian's layout is an improvement over the original layout. Use an appropriate hypothesis test and a significance level of a = 0.05. Store the p-value for this test in the variable p3.a and round your answer to two decimal places. Note: In case you haven't see a data frame before, think of it like a spreadsheet where each row is an instance each data and each column is a vector of specific values. To access the values in the "num_purchases" column, use purchases$num_purchases . # your code here p3.a = NA Part C) Bummer. But Nefarian really wants his design to be an improvement, so what's a little bad science? What if he can find a subset of data that supports his claim? Thinking back, Nefarian remembers that Group C supposedly contained some very impulsive customers. Using the same hypothesis from Part A, determine if Nafarian's layout was a statistically significant improvement at the a = 0.05 significance level, if he only looks at sampels from Group C. Save the p-value of this test as p3.c, rounded to three decimal places. Note: To filter the dataframe to only contain data for Group C, use purchases[purchases$group=="c",]. # your code here p3.c = NA
Step by Step Solution
3.49 Rating (169 Votes )
There are 3 Steps involved in it
Ans Hypothesis Test The purchase 3 ie p3 is 41 p341 A... View full answer

Get step-by-step solutions from verified subject matter experts