

Question: Now, we want to separate the data using ellipsoid. Its equation is: A x 2 + B y 2 + C x + D y
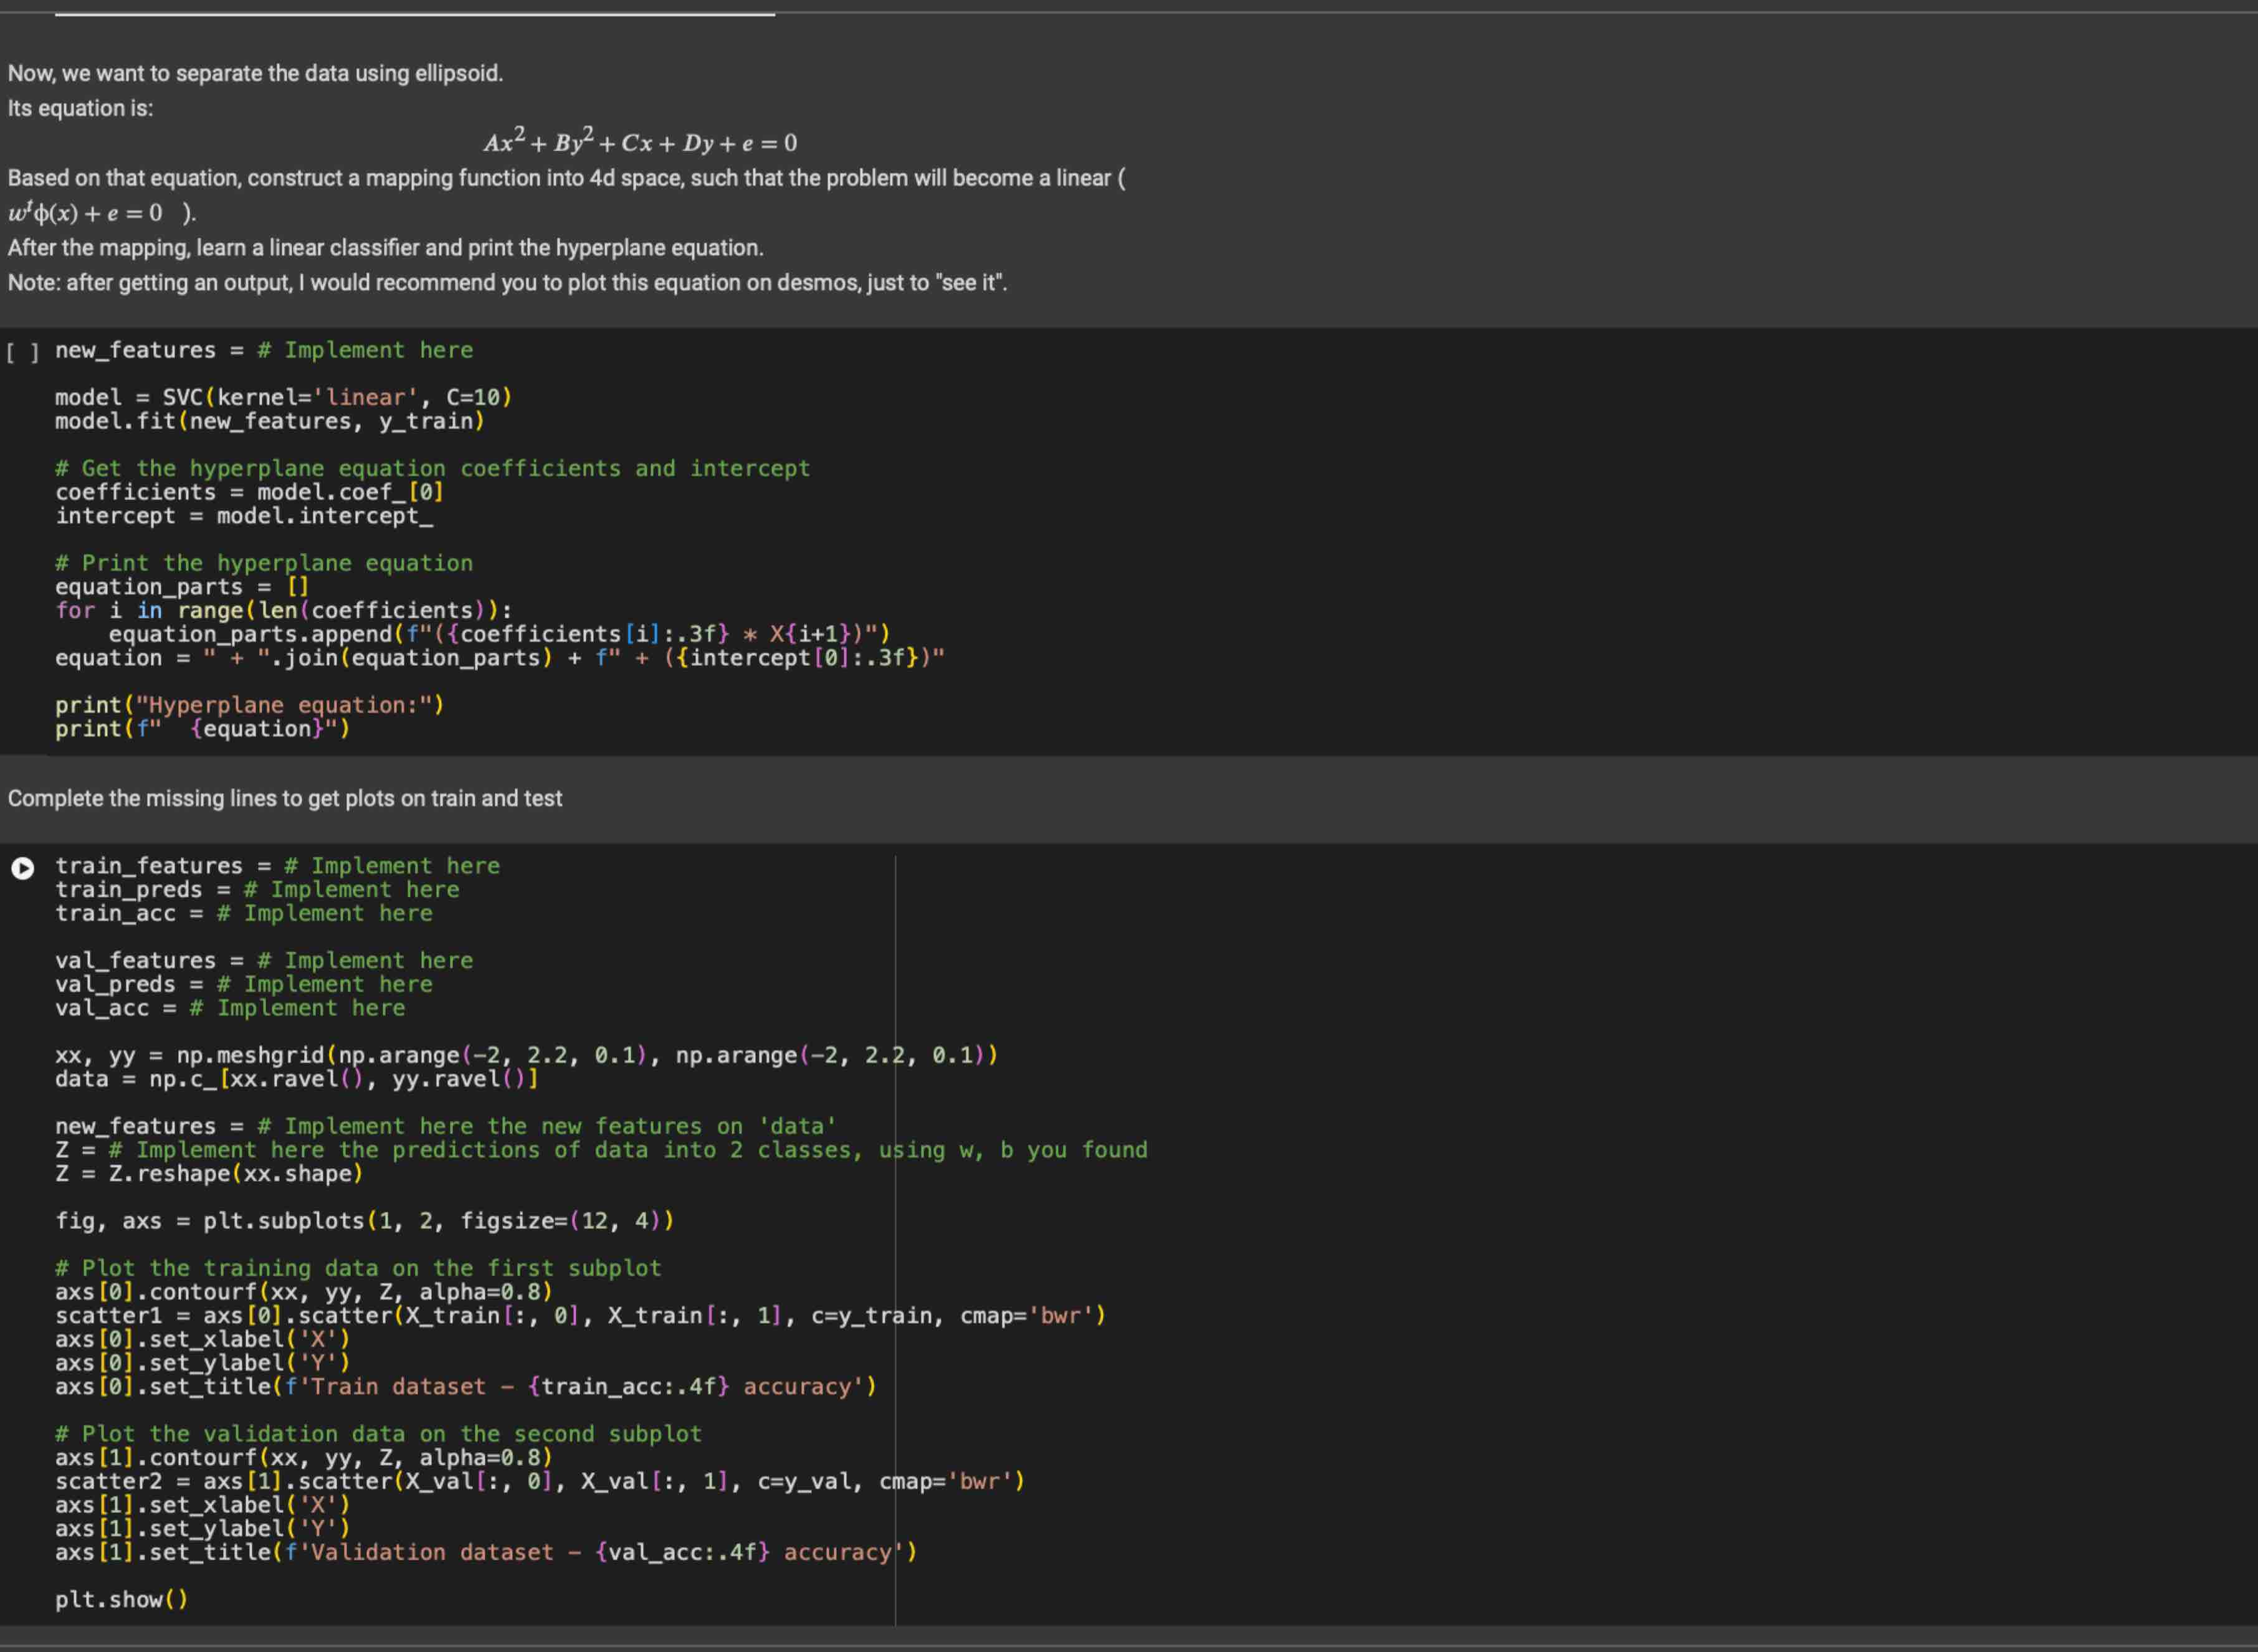
Now, we want to separate the data using ellipsoid.
Its equation is:
Based on that equation, construct a mapping function into space, such that the problem will become a linear
After the mapping, learn a linear classifier and print the hyperplane equation.
Note: after getting an output, I would recommend you to plot this equation on desmos, just to "see it
newfeatures # Implement here
model SVC kernel linear',
model.fitnewfeatures, ytrain
# Get the hyperplane equation coefficients and intercept
coefficients model.coef
intercept model. intercept
# Print the hyperplane equation
equationparts
for in rangelencoefficients:
equationparts.append coefficients ::
equation joinequationparts intercept :f
printHyperplane equation:"
print fequation
Complete the missing lines to get plots on train and test
trainfeatures # Implement here
trainpreds # Implement here
trainacc # Implement here
valfeatures # Implement here
valpreds # Implement here
valacc # Implement here
meshgrid arange arange
data
newfeatures # Implement here the new features on 'data'
# Implement here the predictions of data into classes, using you found
reshape xxshape
fig, axs pltsubplots figsize
# Plot the training data on the first subplot
axs contourf alpha
scatter axs scatterxtrain : Xtrain : cytrain, cmapbwr
axs setxlabel X
axs setylabel
axssettitlefTrain dataset trainacc:f accuracy'
# Plot the validation data on the second subplot
axs contourf alpha
scatter axsscatterxval : Xval : cyval, cmapbwr
axs setxlabel
axs setylabel
axssettitlefValidation dataset valacc:f accuracy'
pltshow
Step by Step Solution
There are 3 Steps involved in it
1 Expert Approved Answer
Step: 1 Unlock

Question Has Been Solved by an Expert!
Get step-by-step solutions from verified subject matter experts
Step: 2 Unlock
Step: 3 Unlock