

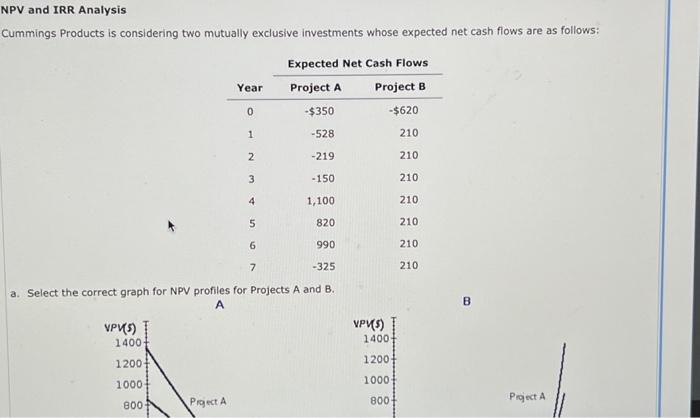
Question: NPV and IRR Analysis Cummings Products is considering two mutually exclusive investments whose expected net cash flows are as follows: VPV(5) 1400- 1200- 1000 800
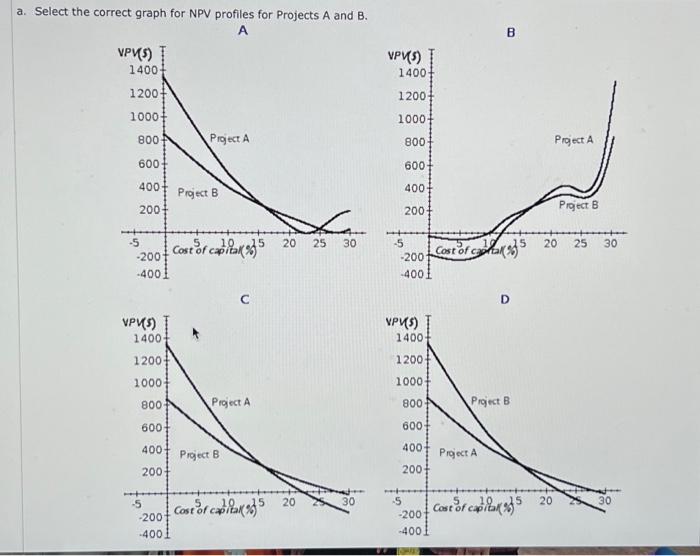
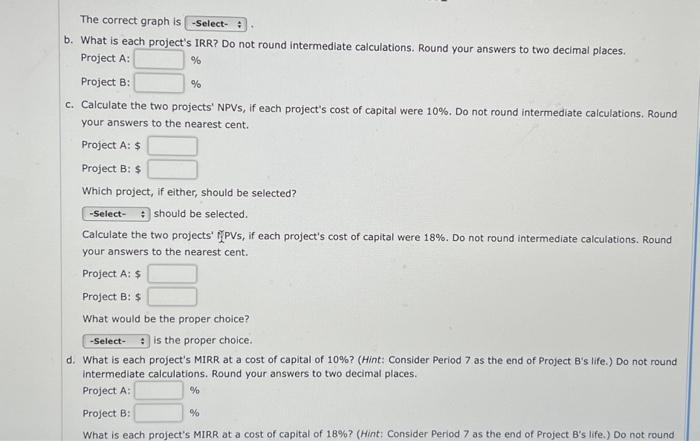
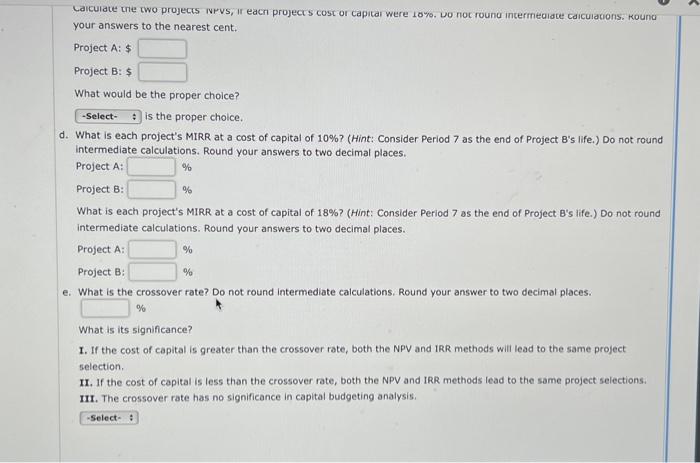
a. Select the correct graph for NPV profiles for Projects A and B. Caiculate the two projects ivrvs, if eacn projects cost or capitar were 10%. vo noc round intermediade caiculations. Koung your answers to the nearest cent. Project A: \$ Project B: $ What would be the proper choice? is the proper cholce. d. What is each project's MIRR at a cost of capital of 10% ? (Hint: Consider Period 7 as the end of Project B's life.) Do not round intermediate calculations. Round your answers to two decimal places. Project A: % Project B: % What is each project's MIRR at a cost of capital of 18% ? (Hint: Consider Period 7 as the end of Project B's life.) Do not round intermediate calculations. Round your answers to two decimal places. ProjectA:ProjectB:%% e. What is the crossover rate? Do not round intermediate calculations. Round your answer to two decimal places. % What is its significance? 1. If the cost of capital is greater than the crossover rate, both the NPV and IRR methods will lead to the same project selection. II. If the cost of capital is less than the crossover rate, both the NPV and IRR methods lead to the same project selections. III. The crossover rate has no significance in capital budgeting analysis. The correct graph is b. What is each project's IRR? Do not round intermediate calculations. Round your answers to two decimal places. Project A: % Project B: % c. Calculate the two projects' NPVs, if each project's cost of capital were 10%. Do not round intermediate calculations. Round your answers to the nearest cent. Project A: \$ Project B: \$ Which project, if either, should be selected? should be selected. Calculate the two projects' PIPVs, if each project's cost of capital were 18%. Do not round intermediate calculations. Round your answers to the nearest cent. Project A: $ Project B: \$ What would be the proper choice? is the proper choice. d. What is each project's MIRR at a cost of capital of 10% ? (Hint: Consider Period 7 as the end of Project B's life.) Do not round intermediate calculations. Round your answers to two decimal places. What is each project's MIRR at a cost of capital of 18% ? (Hint: Consider Period 7 as the end of Project B's life, ) Do not round
Step by Step Solution
There are 3 Steps involved in it

Get step-by-step solutions from verified subject matter experts