

Question: NPV profiles WACC 11.00% (Dollars in Millions) Plan A Plan B begin{tabular}{|c|c|c|c|c|c|c|c|c|c|c|c|c|c|c|c|c|c|c|c|c|} hline 0 & 1 & 2 & 3 & 4 & 5 &
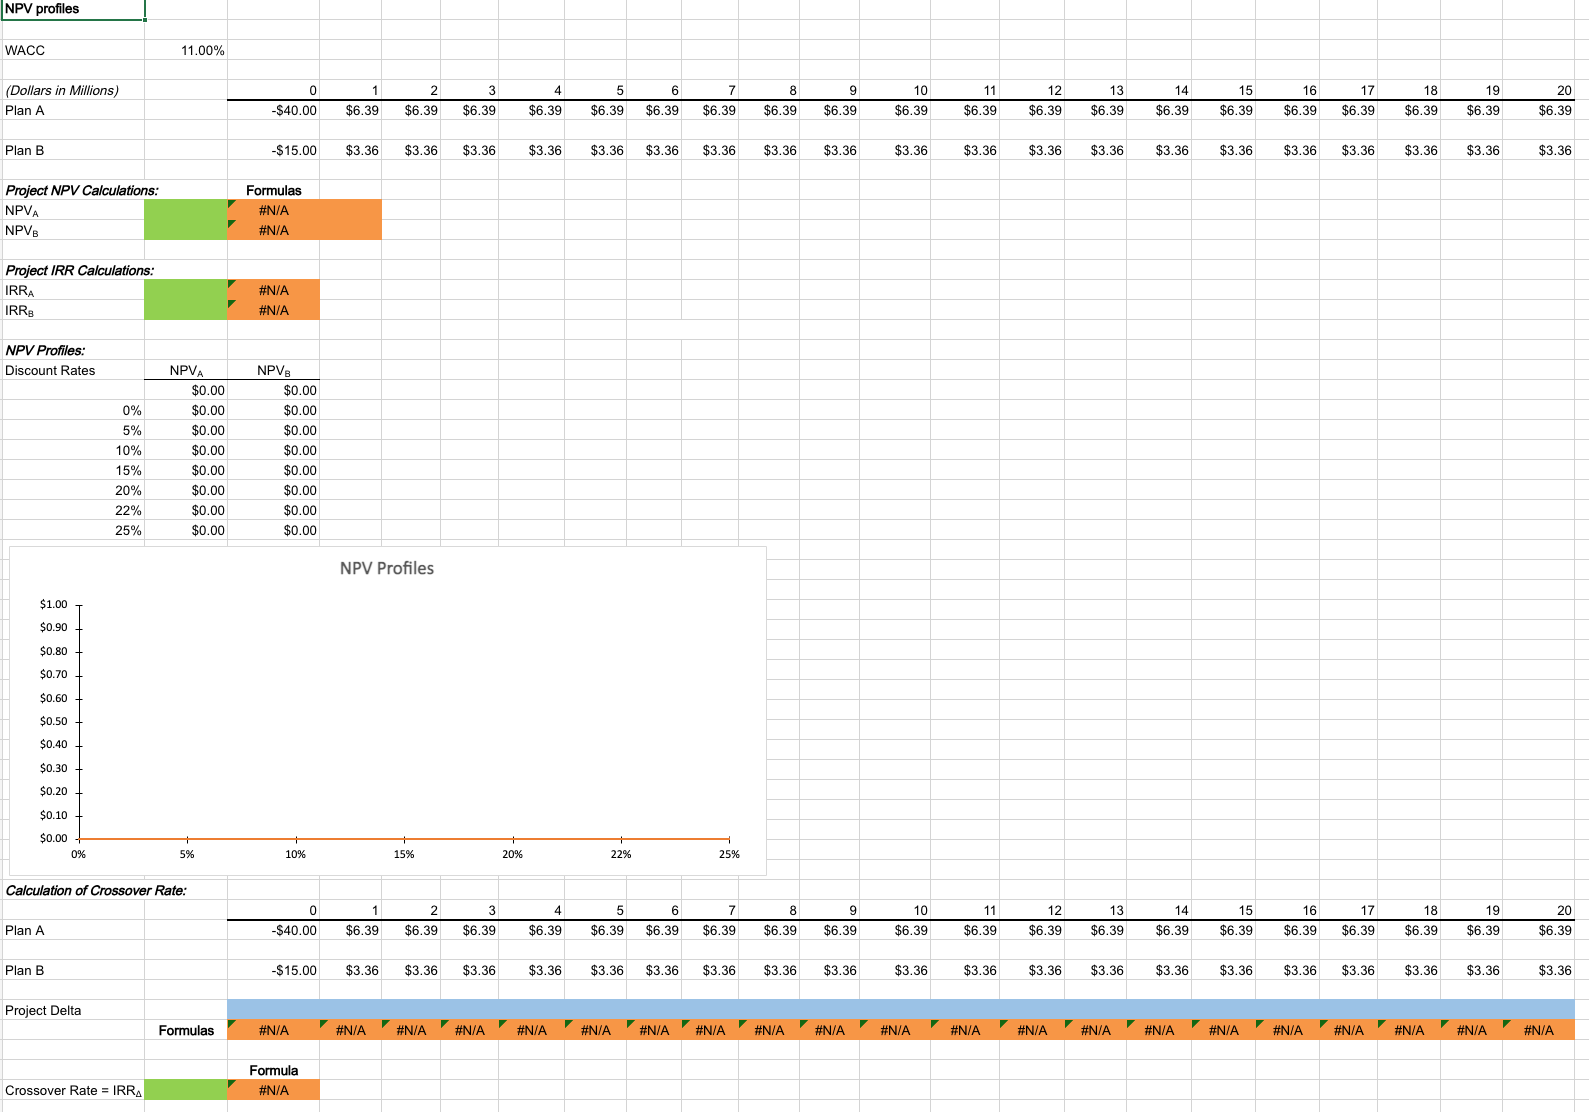
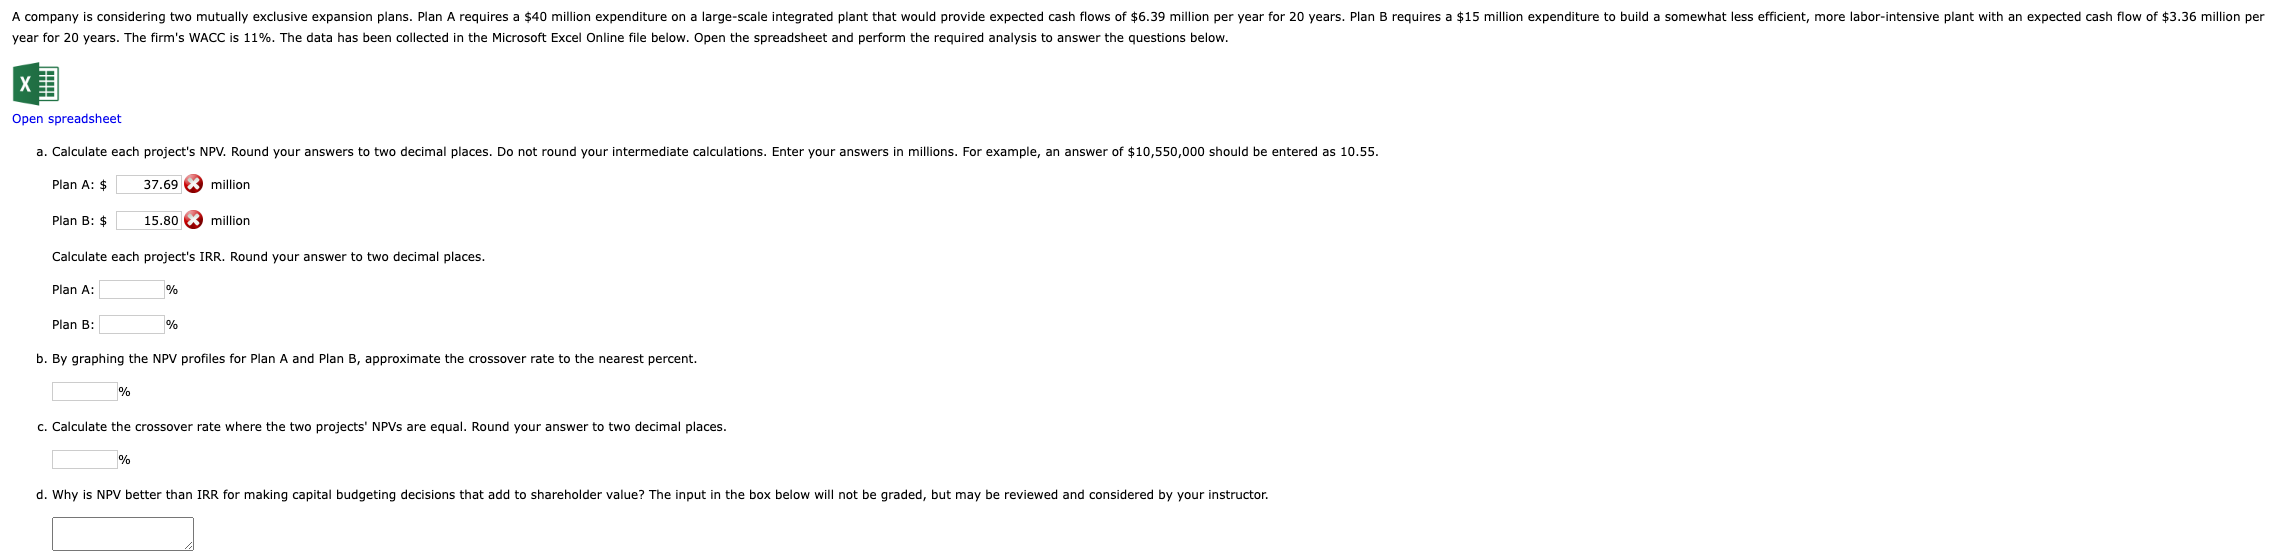
NPV profiles WACC 11.00% (Dollars in Millions) Plan A Plan B \begin{tabular}{|c|c|c|c|c|c|c|c|c|c|c|c|c|c|c|c|c|c|c|c|c|} \hline 0 & 1 & 2 & 3 & 4 & 5 & 6 & 7 & 8 & 9 & 10 & 11 & 12 & 13 & 14 & 15 & 16 & 17 & 18 & 19 & 20 \\ \hline$40.00 & $6.39 & $6.39 & $6.39 & $6.39 & $6.39 & $6.39 & $6.39 & $6.39 & $6.39 & $6.39 & $6.39 & $6.39 & $6.39 & $6.39 & $6.39 & $6.39 & $6.39 & $6.39 & $6.39 & $6.39 \\ \hline$15.00 & $3.36 & $3.36 & $3.36 & $3.36 & $3.36 & $3.36 & $3.36 & $3.36 & $3.36 & $3.36 & $3.36 & $3.36 & $3.36 & $3.36 & $3.36 & $3.36 & $3.36 & $3.36 & $3.36 & $3.36 \\ \hline \end{tabular} Project NPV Calculations: NPVA NPVB Project IRR Calculations: IRRA IRRB NPV Profiles: Discount Rates \begin{tabular}{|r|r|r|} \hline & NPV A & \multicolumn{1}{c|}{ NPV B} \\ \cline { 2 - 4 } & $0.00 & $0.00 \\ \hline 0% & $0.00 & $0.00 \\ \hline 5% & $0.00 & $0.00 \\ \hline 10% & $0.00 & $0.00 \\ \hline 15% & $0.00 & $0.00 \\ \hline 20% & $0.00 & $0.00 \\ \hline 22% & $0.00 & $0.00 \\ \hline 25% & $0.00 & $0.00 \\ \hline \end{tabular} NPV Profiles Calculation of Crossover Rate: Plan A Plan B Project Delta Project Delta Formulas Crossover Rate =IRR Formulas \#N/A \#N/A \#N/A \#N/A \begin{tabular}{|r|} \hline \\ \hline \\ \hline \\ \hline 0.00 \\ \hline 0.00 \\ \hline 0.00 \\ \hline 0.00 \\ \hline \end{tabular} NPV Profiles \begin{tabular}{|c|c|c|c|c|c|c|c|c|c|c|c|c|c|c|c|c|c|c|c|c|} \hline 0 & 1 & 2 & 3 & 4 & 5 & 6 & 7 & 8 & 9 & 10 & 11 & 12 & 13 & 14 & 15 & 16 & 17 & 18 & 19 & 20 \\ \hline$40.00 & $6.39 & $6.39 & $6.39 & $6.39 & $6.39 & $6.39 & $6.39 & $6.39 & $6.39 & $6.39 & $6.39 & $6.39 & $6.39 & $6.39 & $6.39 & $6.39 & $6.39 & $6.39 & $6.39 & $6.39 \\ \hline$15.00 & $3.36 & $3.36 & $3.36 & $3.36 & $3.36 & $3.36 & $3.36 & $3.36 & $3.36 & $3.36 & $3.36 & $3.36 & $3.36 & $3.36 & $3.36 & $3.36 & $3.36 & $3.36 & $3.36 & $3.36 \\ \hline \end{tabular} Formula \#N/A ear for 20 years. The firm's WACC is 11%. The data has been collected in the Microsoft Excel Online file below. Open the spreadsheet and perform the required analysis to answer the questions below. pen spreadsheet Plan A: $ million Plan B: $ million Calculate each project's IRR. Round your answer to two decimal places. Plan B: Plan A: $37.69 million Plan B: $15.80 million Calculate each project's IRR. Round your answer to two decimal places. Plan A: % Plan B: : b. By graphing the NPV profiles for Plan A and Plan B, approximate the crossover rate to the nearest percent. c. Calculate the crossover rate where the two projects' NPVs are equal. Round your answer to two decimal places. NPV profiles WACC 11.00% (Dollars in Millions) Plan A Plan B \begin{tabular}{|c|c|c|c|c|c|c|c|c|c|c|c|c|c|c|c|c|c|c|c|c|} \hline 0 & 1 & 2 & 3 & 4 & 5 & 6 & 7 & 8 & 9 & 10 & 11 & 12 & 13 & 14 & 15 & 16 & 17 & 18 & 19 & 20 \\ \hline$40.00 & $6.39 & $6.39 & $6.39 & $6.39 & $6.39 & $6.39 & $6.39 & $6.39 & $6.39 & $6.39 & $6.39 & $6.39 & $6.39 & $6.39 & $6.39 & $6.39 & $6.39 & $6.39 & $6.39 & $6.39 \\ \hline$15.00 & $3.36 & $3.36 & $3.36 & $3.36 & $3.36 & $3.36 & $3.36 & $3.36 & $3.36 & $3.36 & $3.36 & $3.36 & $3.36 & $3.36 & $3.36 & $3.36 & $3.36 & $3.36 & $3.36 & $3.36 \\ \hline \end{tabular} Project NPV Calculations: NPVA NPVB Project IRR Calculations: IRRA IRRB NPV Profiles: Discount Rates \begin{tabular}{|r|r|r|} \hline & NPV A & \multicolumn{1}{c|}{ NPV B} \\ \cline { 2 - 4 } & $0.00 & $0.00 \\ \hline 0% & $0.00 & $0.00 \\ \hline 5% & $0.00 & $0.00 \\ \hline 10% & $0.00 & $0.00 \\ \hline 15% & $0.00 & $0.00 \\ \hline 20% & $0.00 & $0.00 \\ \hline 22% & $0.00 & $0.00 \\ \hline 25% & $0.00 & $0.00 \\ \hline \end{tabular} NPV Profiles Calculation of Crossover Rate: Plan A Plan B Project Delta Project Delta Formulas Crossover Rate =IRR Formulas \#N/A \#N/A \#N/A \#N/A \begin{tabular}{|r|} \hline \\ \hline \\ \hline \\ \hline 0.00 \\ \hline 0.00 \\ \hline 0.00 \\ \hline 0.00 \\ \hline \end{tabular} NPV Profiles \begin{tabular}{|c|c|c|c|c|c|c|c|c|c|c|c|c|c|c|c|c|c|c|c|c|} \hline 0 & 1 & 2 & 3 & 4 & 5 & 6 & 7 & 8 & 9 & 10 & 11 & 12 & 13 & 14 & 15 & 16 & 17 & 18 & 19 & 20 \\ \hline$40.00 & $6.39 & $6.39 & $6.39 & $6.39 & $6.39 & $6.39 & $6.39 & $6.39 & $6.39 & $6.39 & $6.39 & $6.39 & $6.39 & $6.39 & $6.39 & $6.39 & $6.39 & $6.39 & $6.39 & $6.39 \\ \hline$15.00 & $3.36 & $3.36 & $3.36 & $3.36 & $3.36 & $3.36 & $3.36 & $3.36 & $3.36 & $3.36 & $3.36 & $3.36 & $3.36 & $3.36 & $3.36 & $3.36 & $3.36 & $3.36 & $3.36 & $3.36 \\ \hline \end{tabular} Formula \#N/A ear for 20 years. The firm's WACC is 11%. The data has been collected in the Microsoft Excel Online file below. Open the spreadsheet and perform the required analysis to answer the questions below. pen spreadsheet Plan A: $ million Plan B: $ million Calculate each project's IRR. Round your answer to two decimal places. Plan B: Plan A: $37.69 million Plan B: $15.80 million Calculate each project's IRR. Round your answer to two decimal places. Plan A: % Plan B: : b. By graphing the NPV profiles for Plan A and Plan B, approximate the crossover rate to the nearest percent. c. Calculate the crossover rate where the two projects' NPVs are equal. Round your answer to two decimal places
Step by Step Solution
There are 3 Steps involved in it

Get step-by-step solutions from verified subject matter experts