

Question: nstructions: 1. Convert the data in Cells A12:J25 into Table 2. Add Total row to show the count of Gender column, the average in
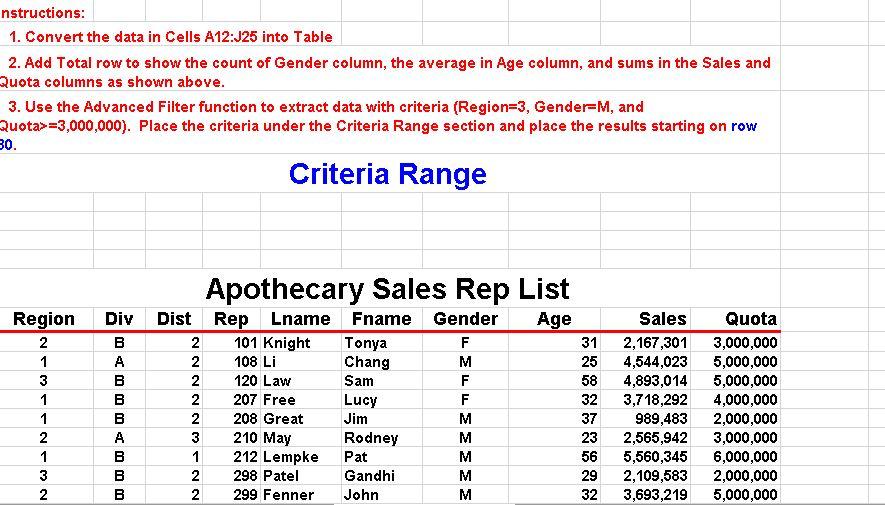
nstructions: 1. Convert the data in Cells A12:J25 into Table 2. Add Total row to show the count of Gender column, the average in Age column, and sums in the Sales and Quota columns as shown above. 3. Use the Advanced Filter function to extract data with criteria (Region=3, Gender-M, and Quota>=3,000,000). Place the criteria under the Criteria Range section and place the results starting on row 30. Criteria Range Apothecary Sales Rep List Region Div Dist Rep Lname Fname Gender Age Sales Quota 2 1 B 3 1 1 2 1 3 2 222223122 BABBBBBB 101 Knight Tonya F 31 2,167,301 3,000,000 108 Li Chang M 25 4,544,023 5,000,000 120 Law Sam F 58 4,893,014 5,000,000 207 Free Lucy F 32 3,718,292 4,000,000 208 Great Jim M 37 989,483 2,000,000 210 May Rodney M 23 2,565,942 3,000,000 212 Lempke Pat M 56 5,560,345 6,000,000 2 298 Patel Gandhi M 29 2,109,583 2,000,000 2 299 Fenner John M 32 3,693,219 5,000,000
Step by Step Solution
There are 3 Steps involved in it

Get step-by-step solutions from verified subject matter experts