

Question: Null hypothesis: there is no relationship between community vulnerability and how the community performs in hazard mitigation planning. I don't know how to interpret this
Null hypothesis: there is no relationship between community vulnerability and how the community performs in hazard mitigation planning.
I don't know how to interpret this data. There doesn't appear to be a relationship, but I'm not sure how the Chi Square tests fit in.
The first two screenshots go together, as do the last two.
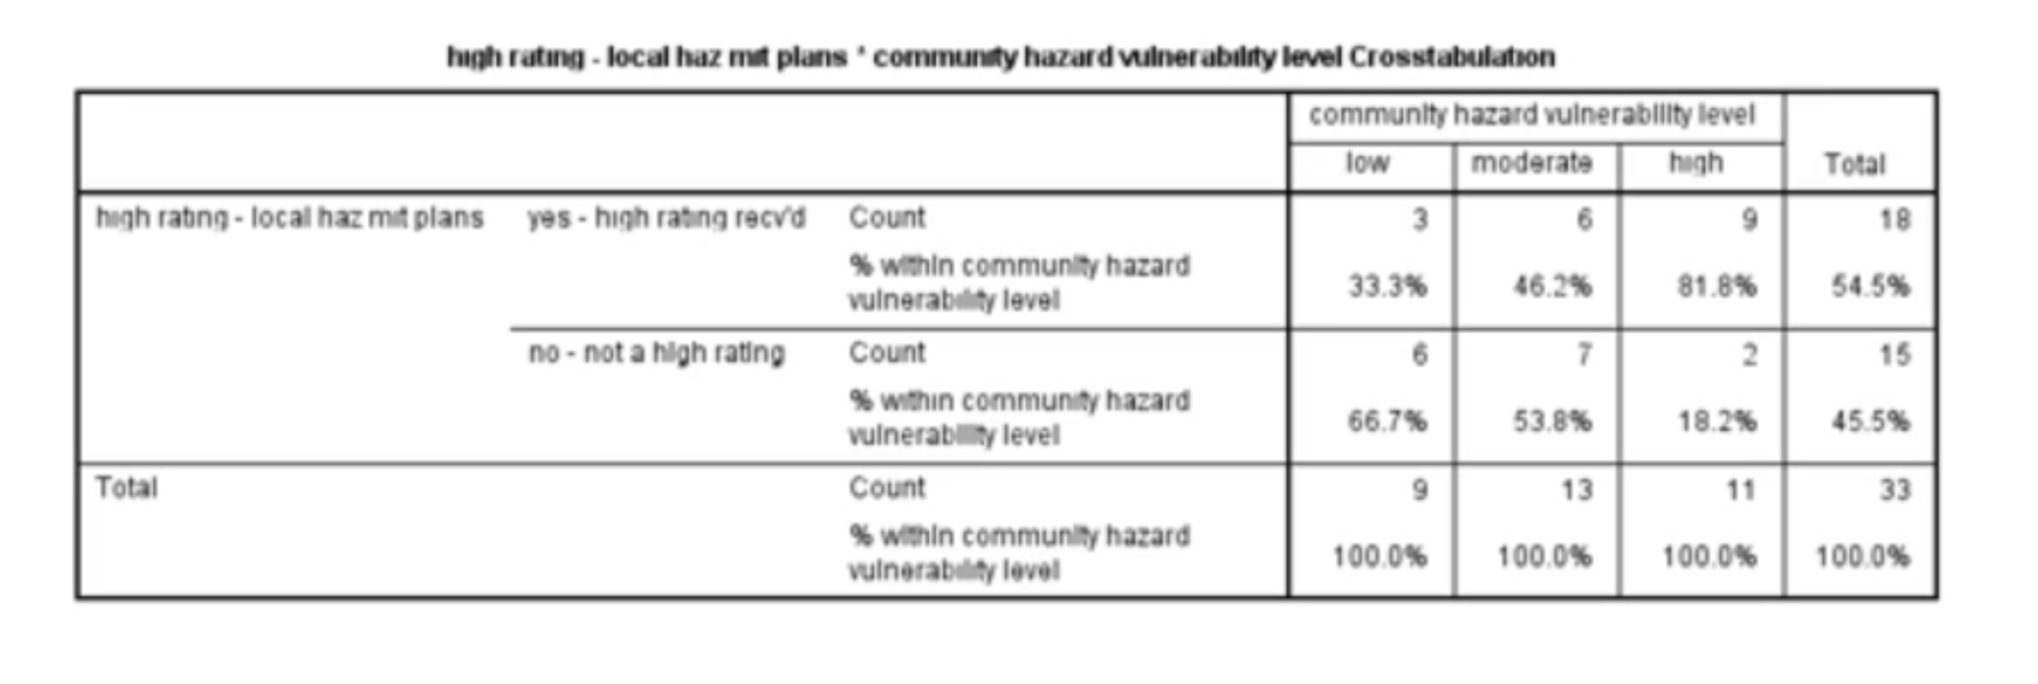
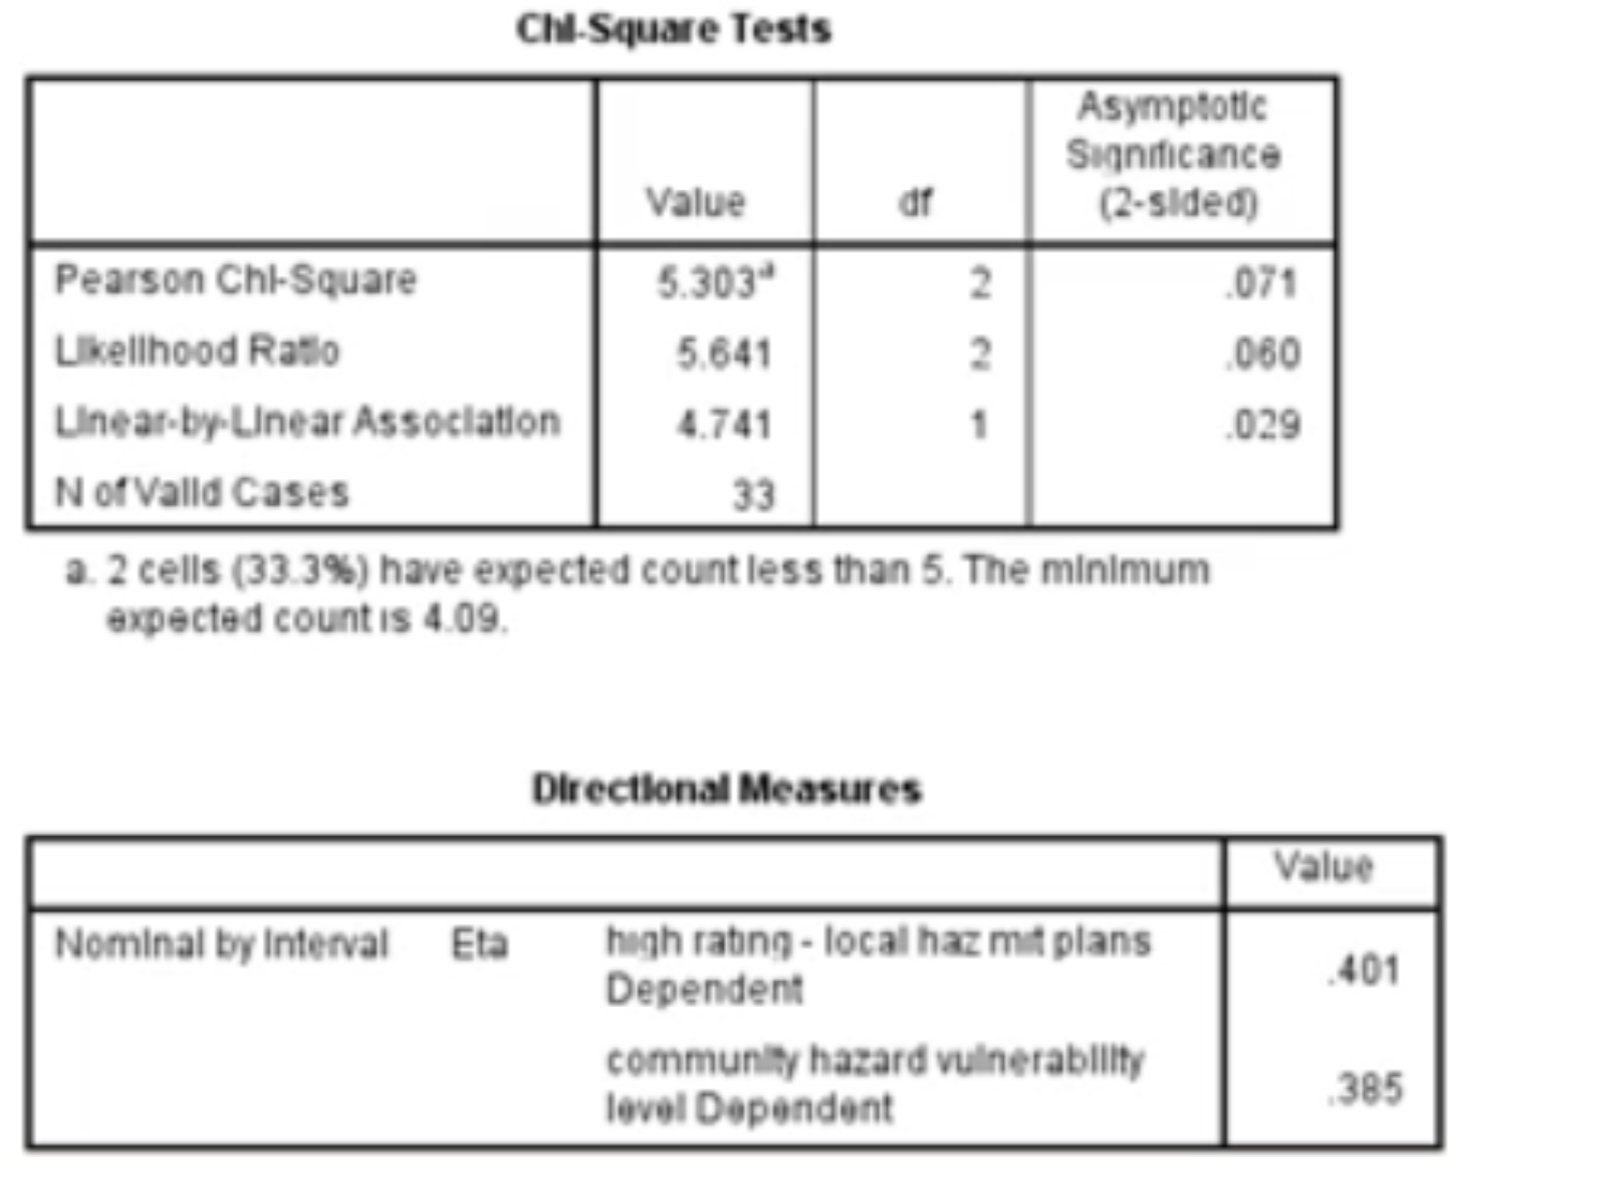
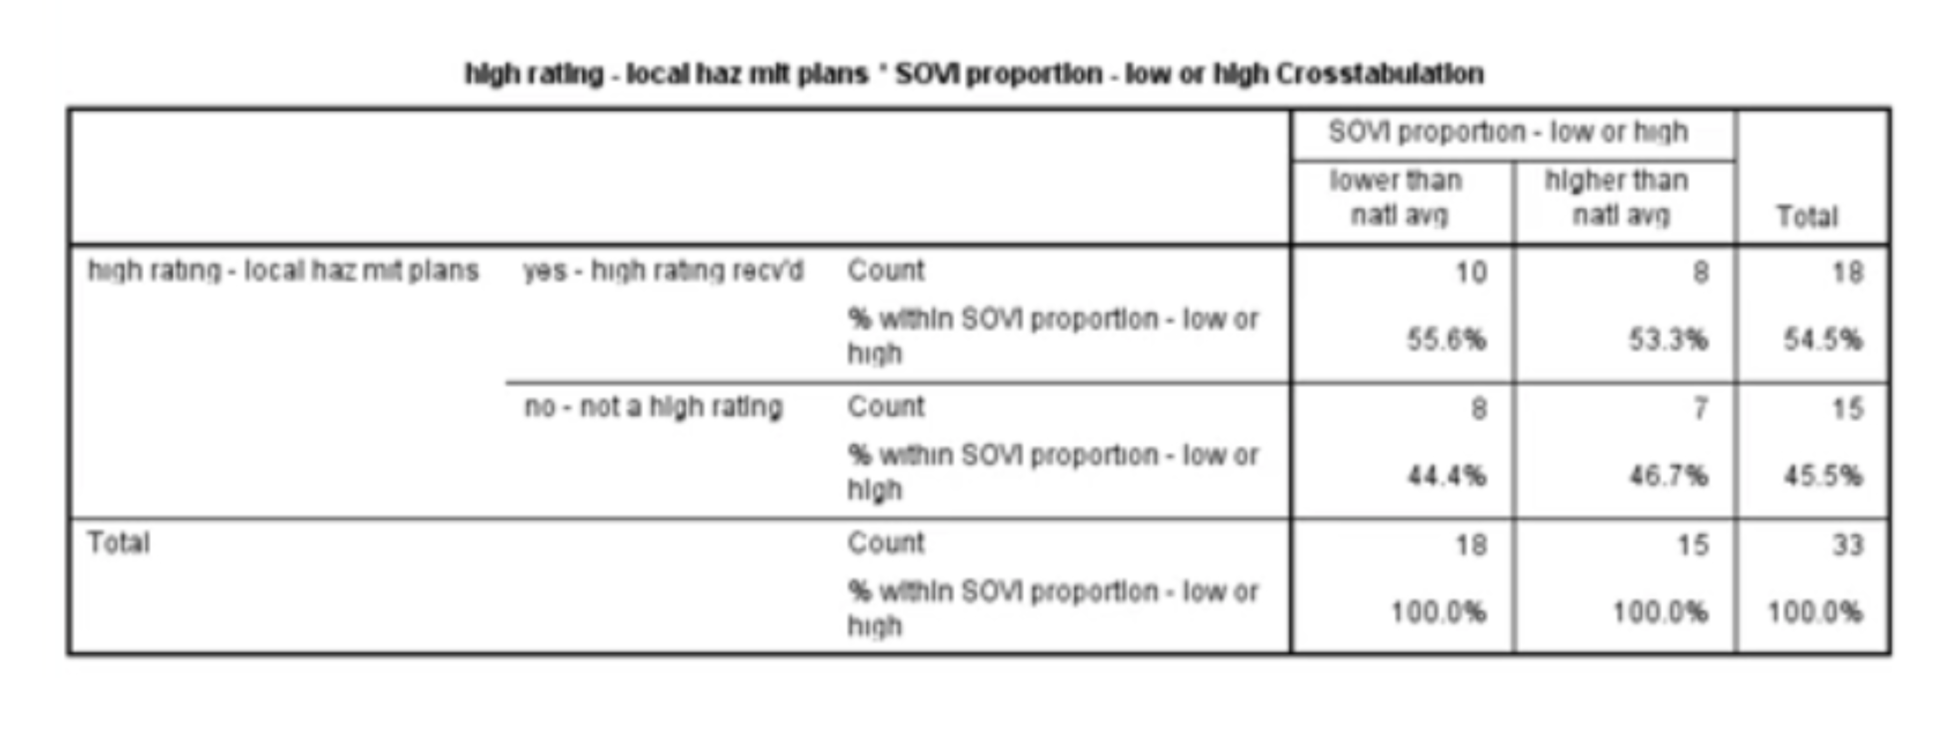
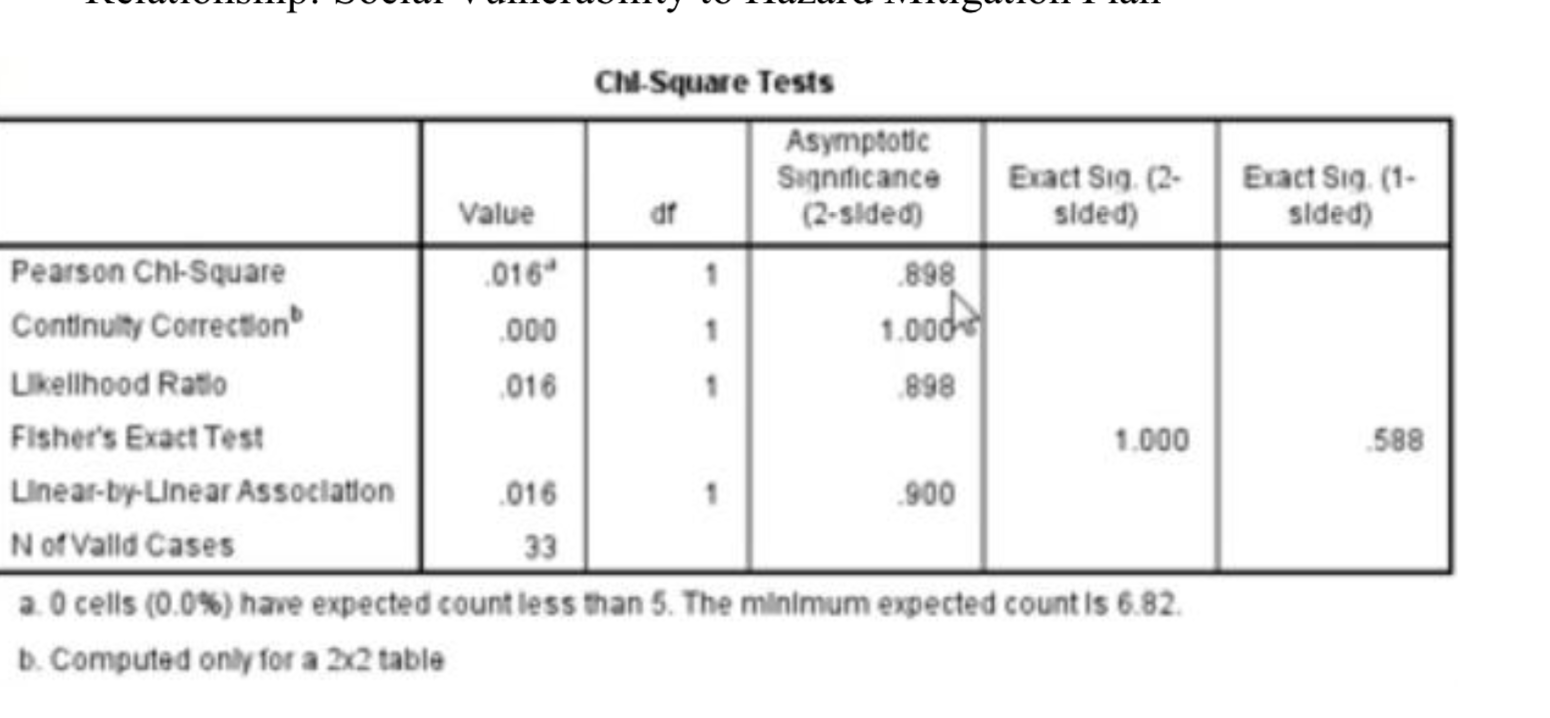
high rating - local haz mit plans * community hazard vulnerability level Crosstabulation community hazard vulnerability level low moderate hagh Total high rating - local haz mit plans yes - high rating rec'd Count 3 9 18 % within community hazard vulnerability level 33.3% 46.2% 81.8% 54.5% no - not a high rating Count 6 7 2 15 % within community hazard vulnerability level 66.7% 53.8% 18.2% 45.5% Total Count 9 13 11 33 % within community hazard vulnerability level 100.0% 100.0% 100.0% 100.0%Chi-Square Tests Asymptotic Significance Value df (2-sided) Pearson Chi-Square 5.303* 2 .071 Likelihood Ratio 5.641 060 Linear-by-Linear Association 4.741 029 N of Valld Cases 33 a. 2 cells (33.3%) have expected count less than 5. The minimum expected count is 4.09. Directional Measures Value Nominal by Interval Eta hagh rating - local haz mit plans Dependent 401 community hazard vulnerability level Dependent .385high rating - local haz mit plans . SOVI proportion - low or high Crosstabulation SOVI proportion - low or high lower than higher than nati avg nati avo Total hagh rating - local haz mit plans yes - high rating rec'd Count 10 8 18 % within SOVI proportion - low or high 55.6% 53.3% 54.5% no - not a high rating Count 8 7 15 % within SOVI proportion - low or high 44.4% 46.7% 45.5% Total Count 18 15 33 % within SOVI proportion - low or high 100.0% 100.0% 100.0%Chi-Square Tests Asymptotic Significance Exact Sig. (2- Exact Sig. (1- Value dr (2-sided) sided) sided) Pearson Chi-Square .016" 898 Continuity Correction 000 1.0005 Likelihood Ratio .016 898 Fisher's Exact Test 1.000 588 Linear-by-Linear Association .016 .900 N of Valld Cases 33 a. 0 cells (0.0%) have expected count less than 5. The minimum expected count is 6.82. b. Computed only for a 2x2 table
Step by Step Solution
There are 3 Steps involved in it

Get step-by-step solutions from verified subject matter experts