

Question: Number 11 8 844 CHAPTER 12 Statistics 7. The graph shows the percentage of students in the United States through grade 12 who were home-schooled
Number 11
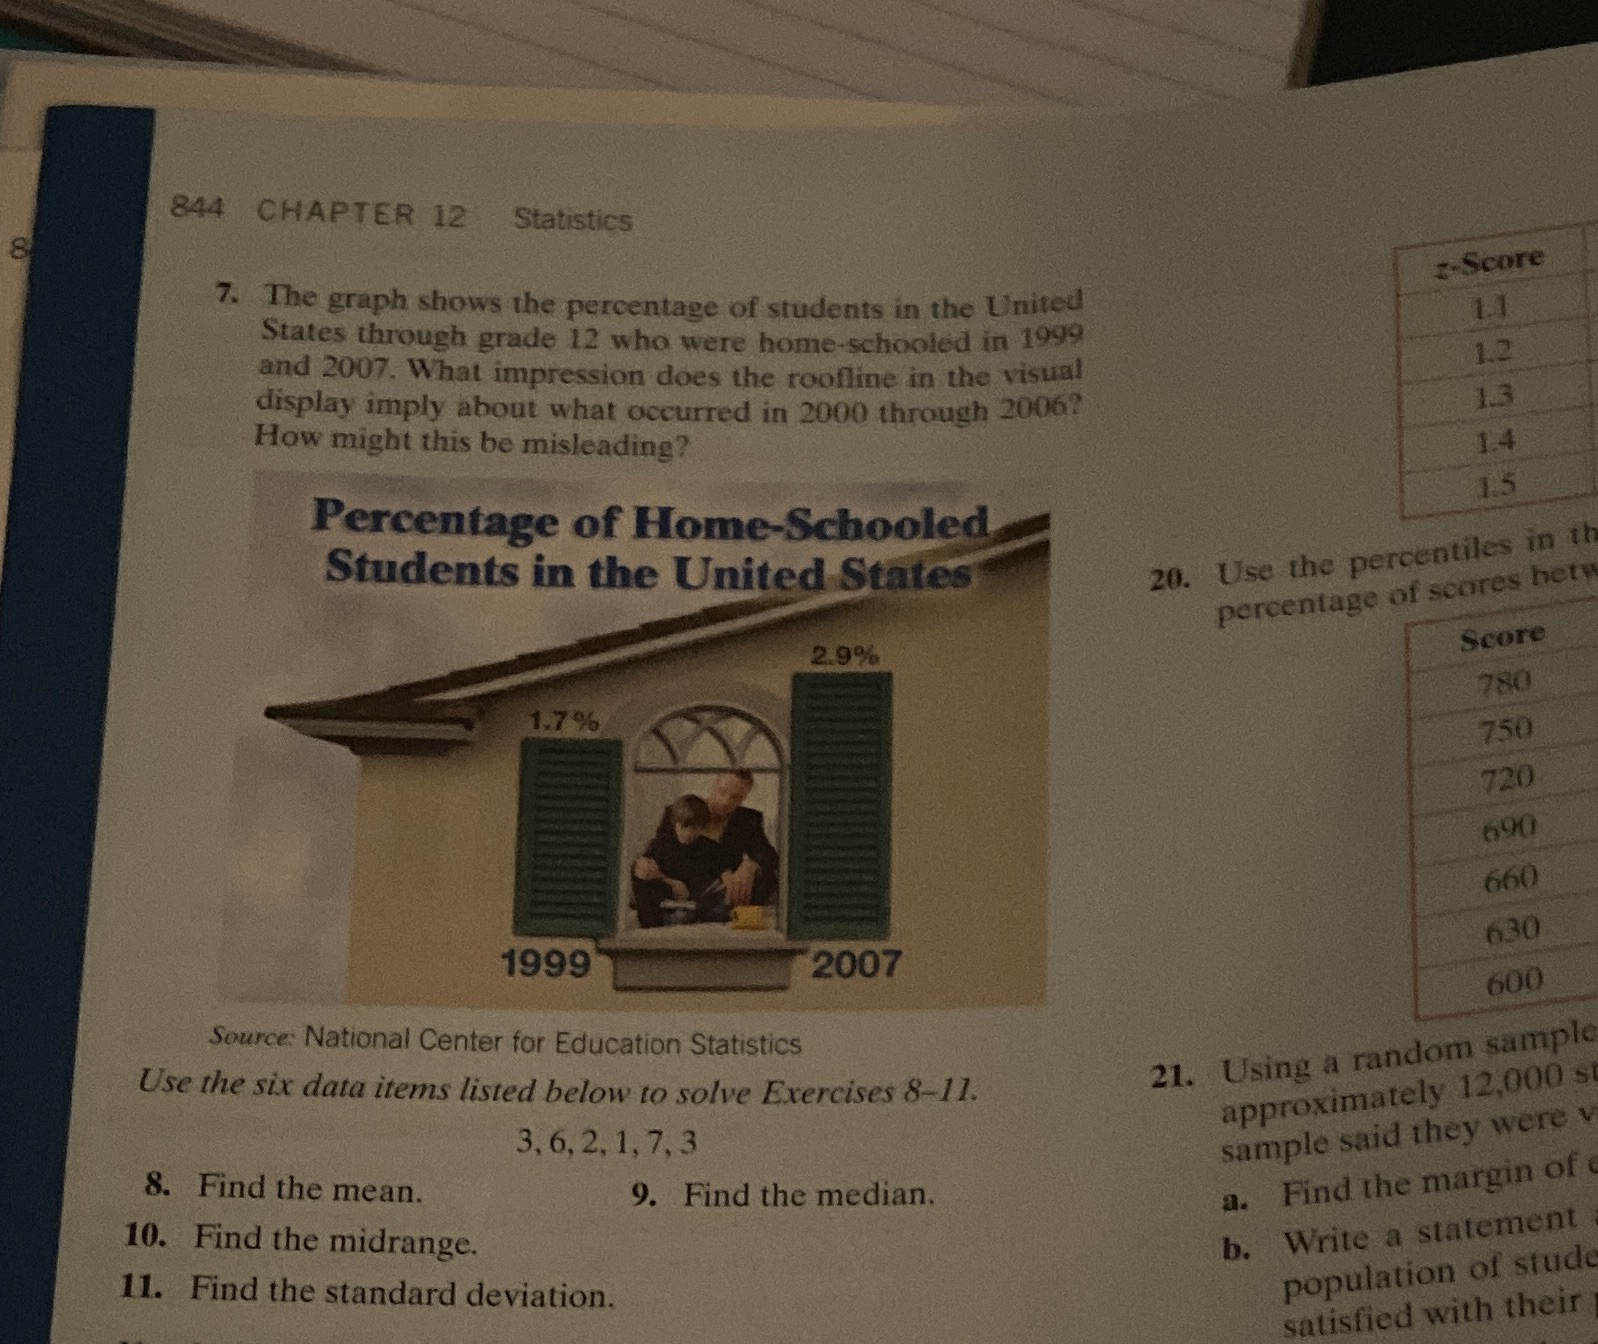
8 844 CHAPTER 12 Statistics 7. The graph shows the percentage of students in the United States through grade 12 who were home-schooled in 1999 z-Score and 2007. What impression does the roofline in the visual 1.1 display imply about what occurred in 2000 through 2006? How might this be misleading? 1.2 1.3 Percentage of Home-Schooled 1.4 Students in the United States 15 20. Use the percentiles in t 2.9% percentage of scores het 1.7% Score 780 750 720 690 1999 660 2007 630 Source: National Center for Education Statistics 600 Use the six data items listed below to solve Exercises 8-11. 8. Find the mean. 3, 6, 2, 1, 7, 3 21. Using a random sample approximately 12,000 s 10. Find the midrange. 9. Find the median. sample said they were 11. Find the standard deviation. a. Find the margin of b. Write a statement population of stud satisfied with their
Step by Step Solution
There are 3 Steps involved in it

Get step-by-step solutions from verified subject matter experts