

Question: Number 3/4 needed only The following graph shows the pathogenesis curve for a certain infectious disease from the time when the pathogen enters the person's
Number 3/4 needed only

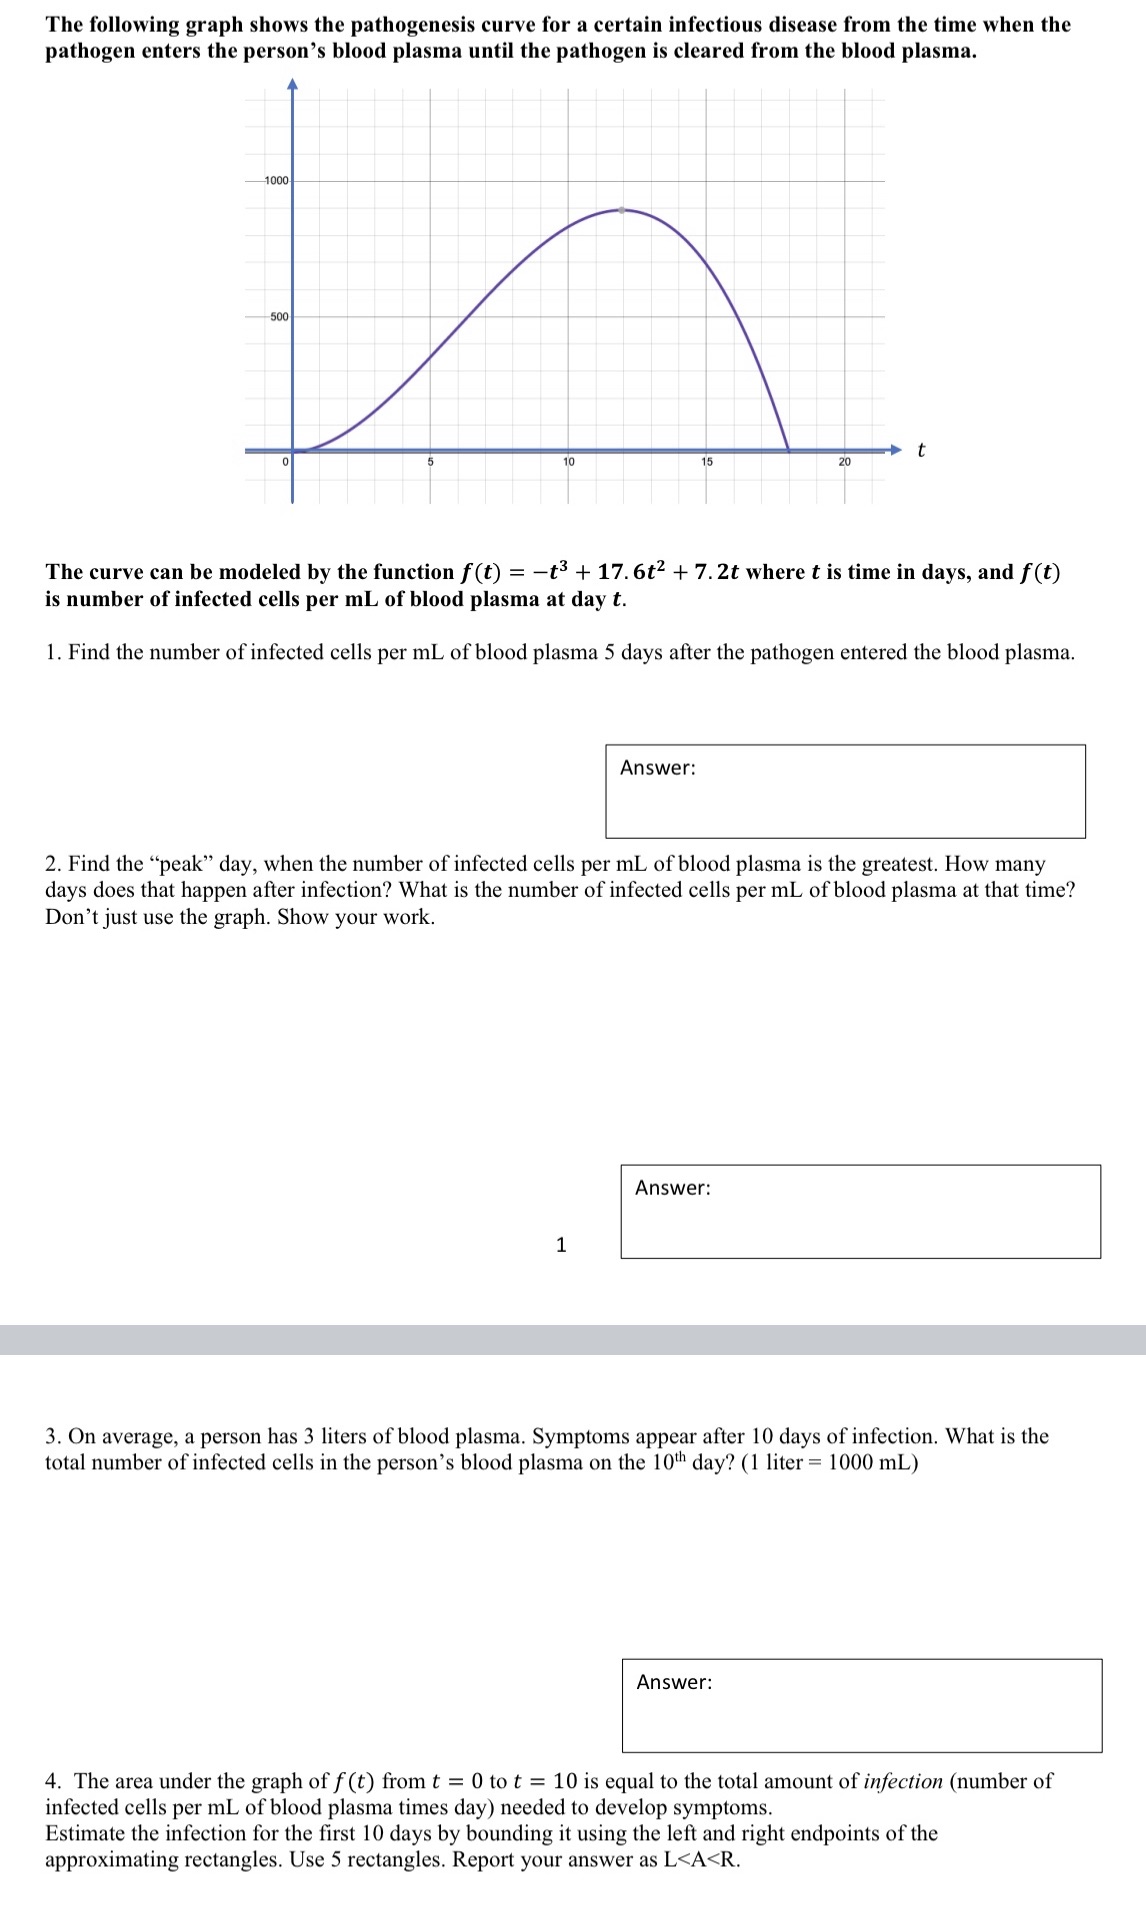
The following graph shows the pathogenesis curve for a certain infectious disease from the time when the pathogen enters the person's blood plasma until the pathogen is cleared from the blood plasma. -1000 -500 10 20 The curve can be modeled by the function f(t) = -t3 + 17. 6t2 + 7. 2t where t is time in days, and f(t) is number of infected cells per mL of blood plasma at day t. 1. Find the number of infected cells per mL of blood plasma 5 days after the pathogen entered the blood plasma. Answer: 2. Find the "peak" day, when the number of infected cells per mL of blood plasma is the greatest. How many days does that happen after infection? What is the number of infected cells per mL of blood plasma at that time? Don't just use the graph. Show your work. Answer: 3. On average, a person has 3 liters of blood plasma. Symptoms appear after 10 days of infection. What is the total number of infected cells in the person's blood plasma on the 10th day? (1 liter = 1000 mL) Answer: 4. The area under the graph of f (t) from t = 0 to t = 10 is equal to the total amount of infection (number of infected cells per mL of blood plasma times day) needed to develop symptoms. Estimate the infection for the first 10 days by bounding it using the left and right endpoints of the approximationg rectangles. Use 5 rectangles. Report your answer as LA
Step by Step Solution
There are 3 Steps involved in it

Get step-by-step solutions from verified subject matter experts