

Question: number 5, 6, and 7 please. MATH 122Q Lab Assignment 3 50 points Due Class 17 ALL WORK MUST BE SHOWN in order to receive
 number 5, 6, and 7 please.
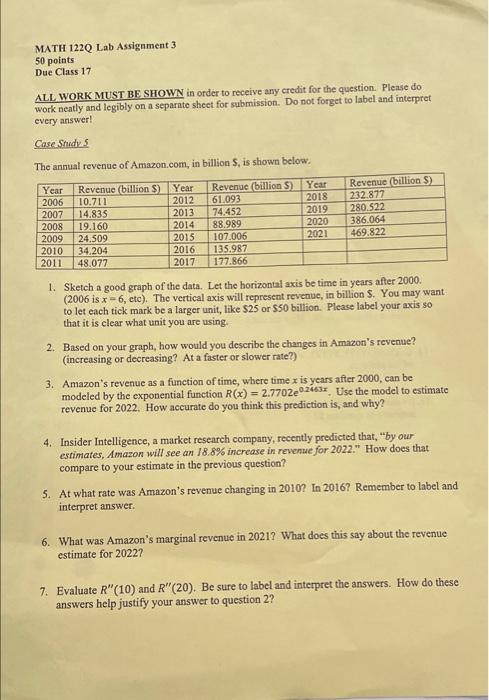
MATH 122Q Lab Assignment 3 50 points Due Class 17 ALL WORK MUST BE SHOWN in order to receive any credit for the question. Please do work neatly and legibly on a separate sheet for submission. Do not forget to label and interpret every answer! Case Study The annual revenue of Amazon.com, in billion S. is shown below. Year 2006 2007 2008 2009 2010 2011 Revenue (billion $) Year 10.711 2012 14.835 2013 19.160 2014 24.509 2015 34,204 2016 48.077 2017 Revenue (billion ) 61.093 74.452 88.989 107.006 135.987 177.866 Year 2018 2019 2020 2021 Revenue (billion S) 232.877 280.522 386.064 469.822 1. Sketch a good graph of the data. Let the horizontal axis be time in years after 2000. (2006 is.x = 6, etc). The vertical axis will represent revenue, in billion $. You may want to let each tick mark be a larger unit, like $25 or $50 billion. Please label your axis so that it is clear what unit you are using 2. Based on your graph, how would you describe the changes in Amazon's revenue? (increasing or decreasing? At a faster or slower rate?) 3. Amazon's revenue as a function of time, where time x is years after 2000, can be modeled by the exponential function R(x) = 2.7702021833. Use the model to estimate revenue for 2022. How accurate do you think this prediction is, and why? 4. Insider Intelligence, a market research company, recently predicted that, "by our estimates, Amazon will see an 18.8% increase in revenue for 2022." How does that compare to your estimate in the previous question? 5. At what rate was Amazon's revenue changing in 2010? In 2016? Remember to label and interpret answer 6. What was Amazon's marginal revenue in 2021? What does this say about the revenue estimate for 20222 7. Evaluate R"(10) and R"(20). Be sure to label and interpret the answers. How do these answers help justify your answer to question 2? MATH 122Q Lab Assignment 3 50 points Due Class 17 ALL WORK MUST BE SHOWN in order to receive any credit for the question. Please do work neatly and legibly on a separate sheet for submission. Do not forget to label and interpret every answer! Case Study The annual revenue of Amazon.com, in billion S. is shown below. Year 2006 2007 2008 2009 2010 2011 Revenue (billion $) Year 10.711 2012 14.835 2013 19.160 2014 24.509 2015 34,204 2016 48.077 2017 Revenue (billion ) 61.093 74.452 88.989 107.006 135.987 177.866 Year 2018 2019 2020 2021 Revenue (billion S) 232.877 280.522 386.064 469.822 1. Sketch a good graph of the data. Let the horizontal axis be time in years after 2000. (2006 is.x = 6, etc). The vertical axis will represent revenue, in billion $. You may want to let each tick mark be a larger unit, like $25 or $50 billion. Please label your axis so that it is clear what unit you are using 2. Based on your graph, how would you describe the changes in Amazon's revenue? (increasing or decreasing? At a faster or slower rate?) 3. Amazon's revenue as a function of time, where time x is years after 2000, can be modeled by the exponential function R(x) = 2.7702021833. Use the model to estimate revenue for 2022. How accurate do you think this prediction is, and why? 4. Insider Intelligence, a market research company, recently predicted that, "by our estimates, Amazon will see an 18.8% increase in revenue for 2022." How does that compare to your estimate in the previous question? 5. At what rate was Amazon's revenue changing in 2010? In 2016? Remember to label and interpret answer 6. What was Amazon's marginal revenue in 2021? What does this say about the revenue estimate for 20222 7. Evaluate R"(10) and R"(20). Be sure to label and interpret the answers. How do these answers help justify your answer to question 2
Step by Step Solution
There are 3 Steps involved in it

Get step-by-step solutions from verified subject matter experts