

Question: number 7 please answer winthin 30mins Question 7 16 pts 9 1 0 Details Prior to a new drive-through system, the mean wait time at
number 7 please answer winthin 30mins
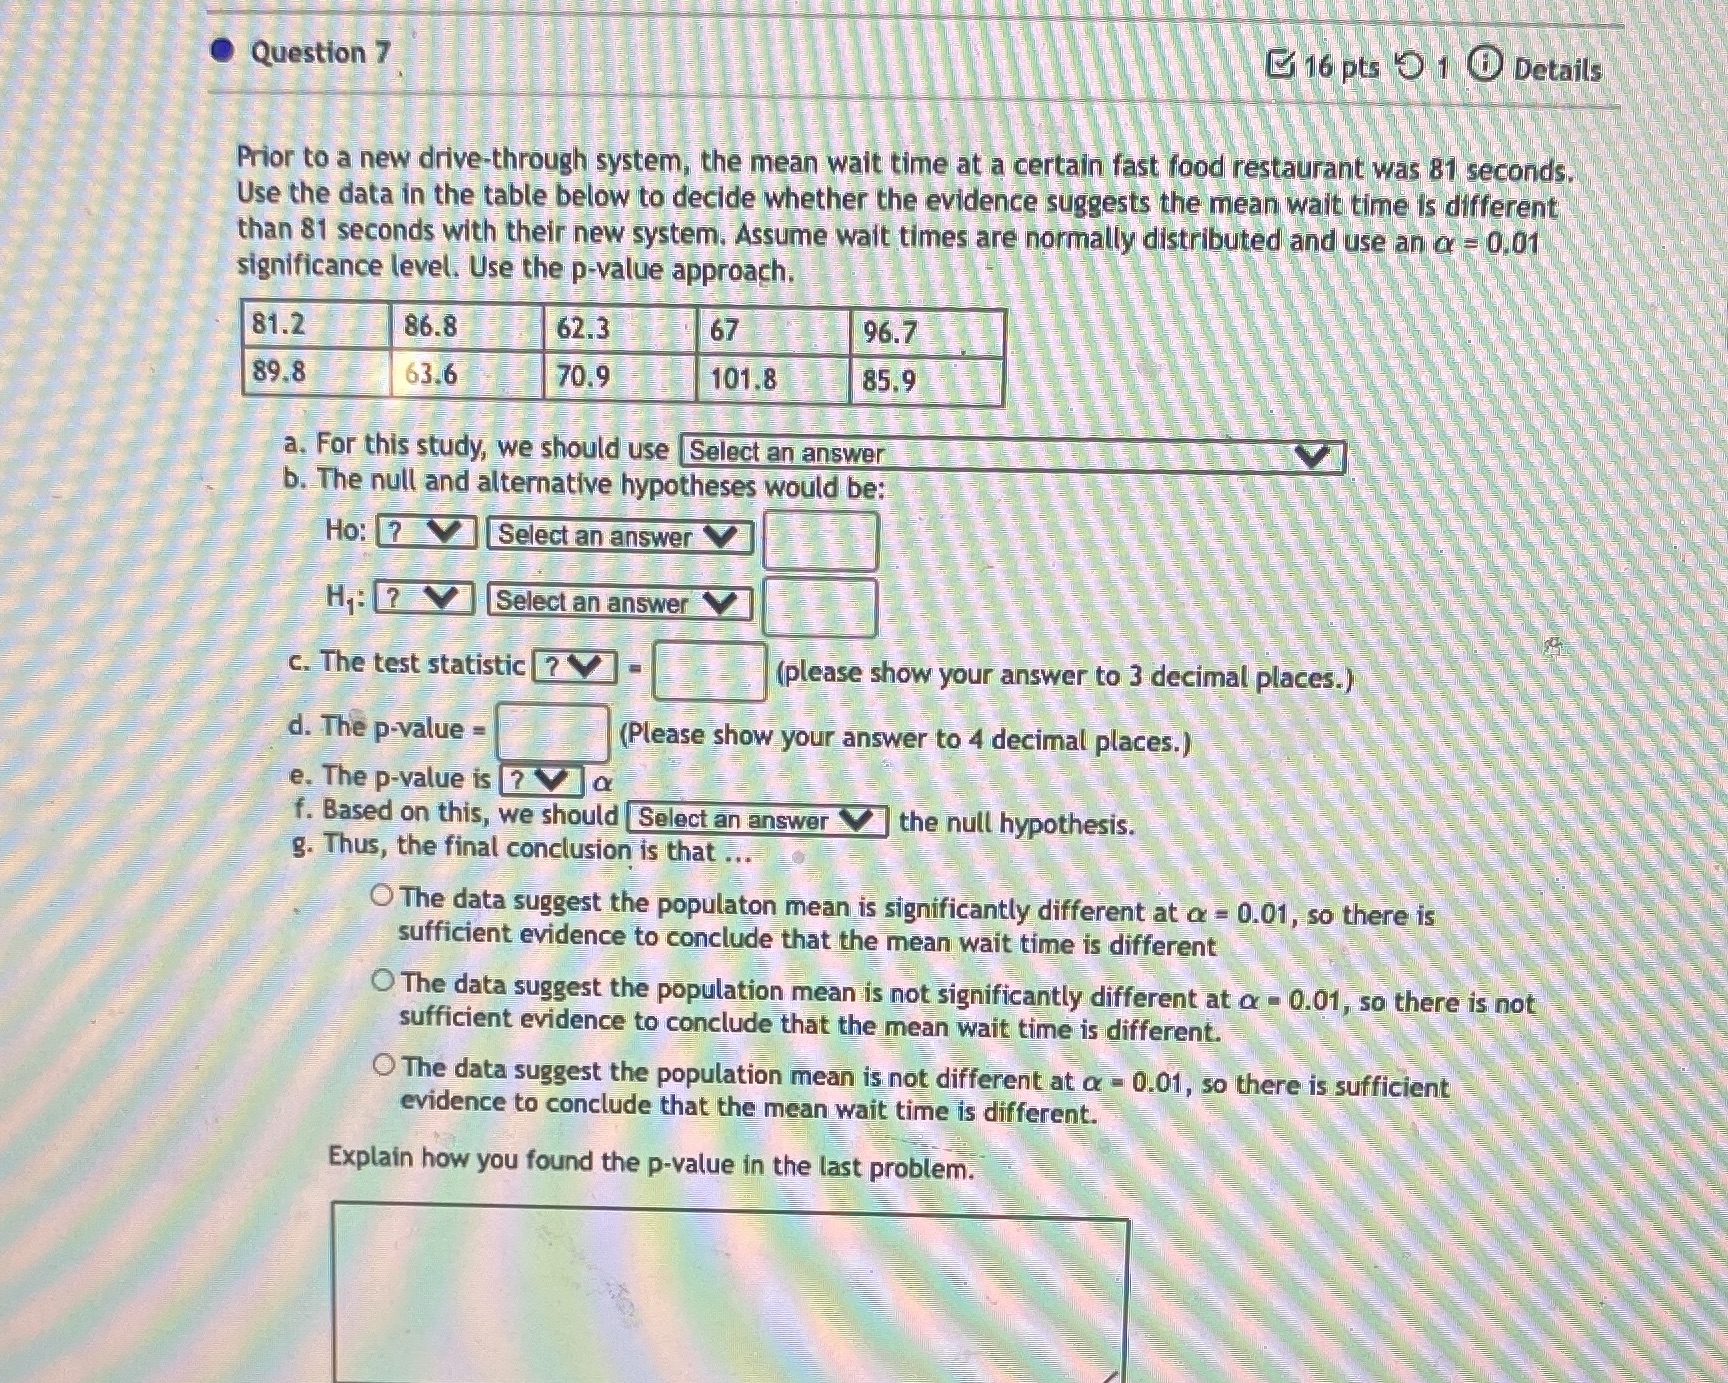
Question 7 16 pts 9 1 0 Details Prior to a new drive-through system, the mean wait time at a certain fast food restaurant was 81 seconds, Use the data in the table below to decide whether the evidence suggests the mean wait time is different than 81 seconds with their new system. Assume wait times are normally distributed and use an c = 0.01 significance level. Use the p-value approach. 81.2 86.8 62.3 67 96.7 89.8 63.6 70.9 101.8 85.9 a. For this study, we should use Select an answer b. The null and alternative hypotheses would be: Ho: ? Select an answer H,: 7 \\ Select an answer c. The test statistic ? (please show your answer to 3 decimal places.) d. The p-value = (Please show your answer to 4 decimal places.) e. The p-value is ? f. Based on this, we should |Select an answer the null hypothesis. g. Thus, the final conclusion is that ... O The data suggest the populaton mean is significantly different at a = 0.01, so there is sufficient evidence to conclude that the mean wait time is different O The data suggest the population mean is not significantly different at or - 0.01, so there is not sufficient evidence to conclude that the mean wait time is different. The data suggest the population mean is not different at o - 0.01, so there is sufficient evidence to conclude that the mean wait time is different. Explain how you found the p-value in the last
Step by Step Solution
There are 3 Steps involved in it

Get step-by-step solutions from verified subject matter experts