

Question: numbers : 68 20 76 55 561 84 65 20 13 305 128 20 28 196 120 66 60 78 83 30 100 115 160
numbers :
68
20
76
55
561
84
65
20
13
305
128
20
28
196
120
66
60
78
83
30
100
115
160
81
46
98
29
34
40
38
155
45
342
136
6
205
58
65
232
22
67
25
90
409
45
18
145
113
36
100
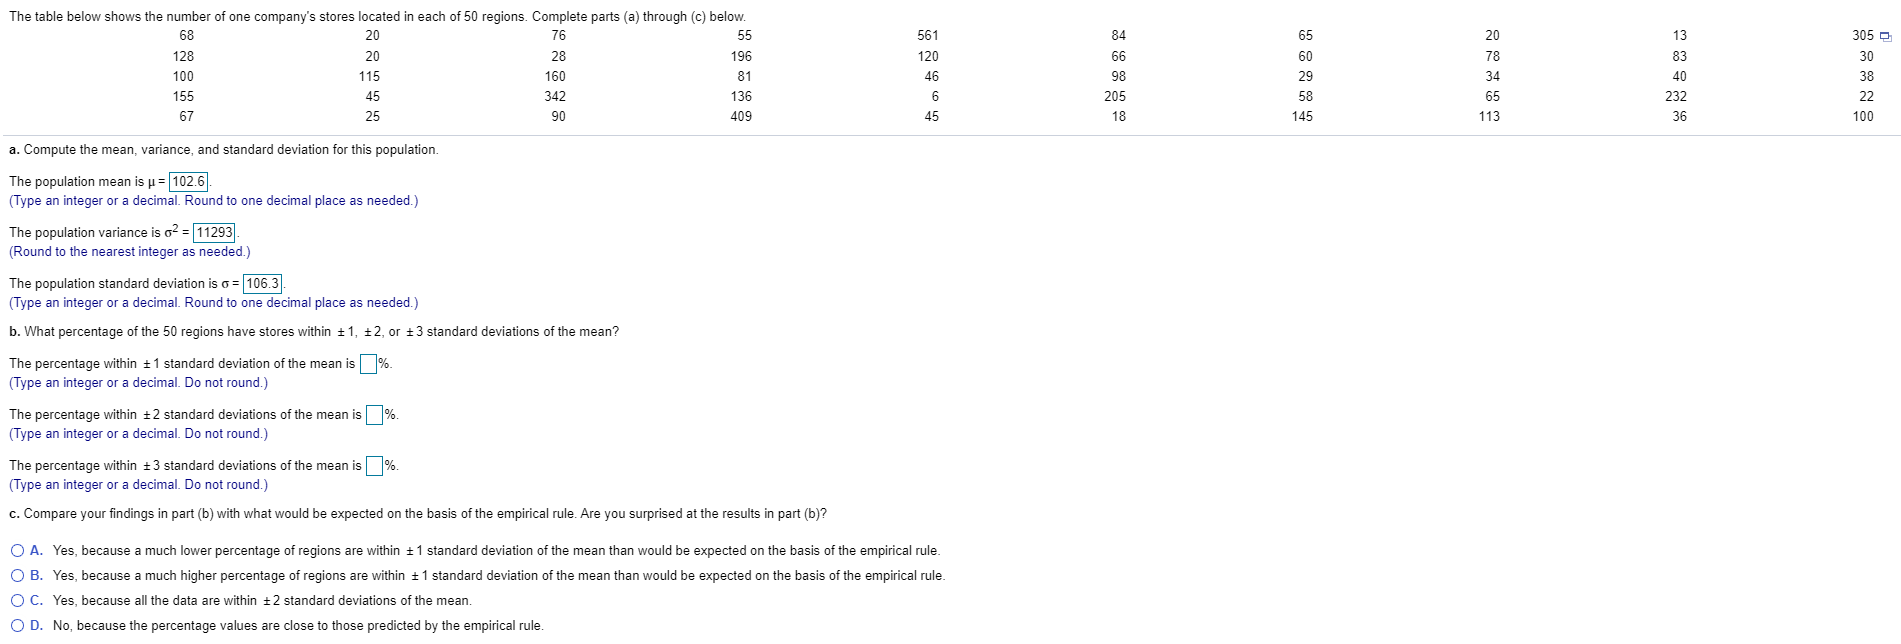
The table below shows the number of one company's stores located in each of 50 regions. Complete parts (a) through (c) below. 68 20 76 55 561 84 65 20 305 0 128 20 28 196 120 66 78 30 100 115 160 81 46 98 29 34 38 155 45 342 136 205 65 232 22 67 25 90 409 45 18 145 113 36 100 a. Compute the mean, variance, and standard deviation for this population. The population mean is u = 102.6 (Type an integer or a decimal. Round to one decimal place as needed.) The population variance is 62 = 11293 (Round to the nearest integer as needed.) The population standard deviation is o = 106.3 (Type an integer or a decimal. Round to one decimal place as needed.) b. What percentage of the 50 regions have stores within + 1, +2, or + 3 standard deviations of the mean? The percentage within 1 1 standard deviation of the mean is% (Type an integer or a decimal. Do not round.) The percentage within 12 standard deviations of the mean is% (Type an integer or a decimal. Do not round. The percentage within 13 standard deviations of the mean is%. (Type an integer or a decimal. Do not round.) c. Compare your findings in part (b) with what would be expected on the basis of the empirical rule. Are you surprised at the results in part (b)? O A. Yes, because a much lower percentage of regions are within 1 1 standard deviation of the mean than would be expected on the basis of the empirical rule. O B. Yes, because a much higher percentage of regions are within 1 1 standard deviation of the mean than would be expected on the basis of the empirical rule. O C. Yes, because all the data are within + 2 standard deviations of the mean O D. No, because the percentage values are close to those predicted by the empirical rule
Step by Step Solution
There are 3 Steps involved in it

Get step-by-step solutions from verified subject matter experts