

Question: numerical analysis, please do it in python or c++, and could you give me the codes also? thanks!! Problem 2.3 (6 points): You invested $1,000,000
numerical analysis, please do it in python or c++, and could you give me the codes also?
thanks!!
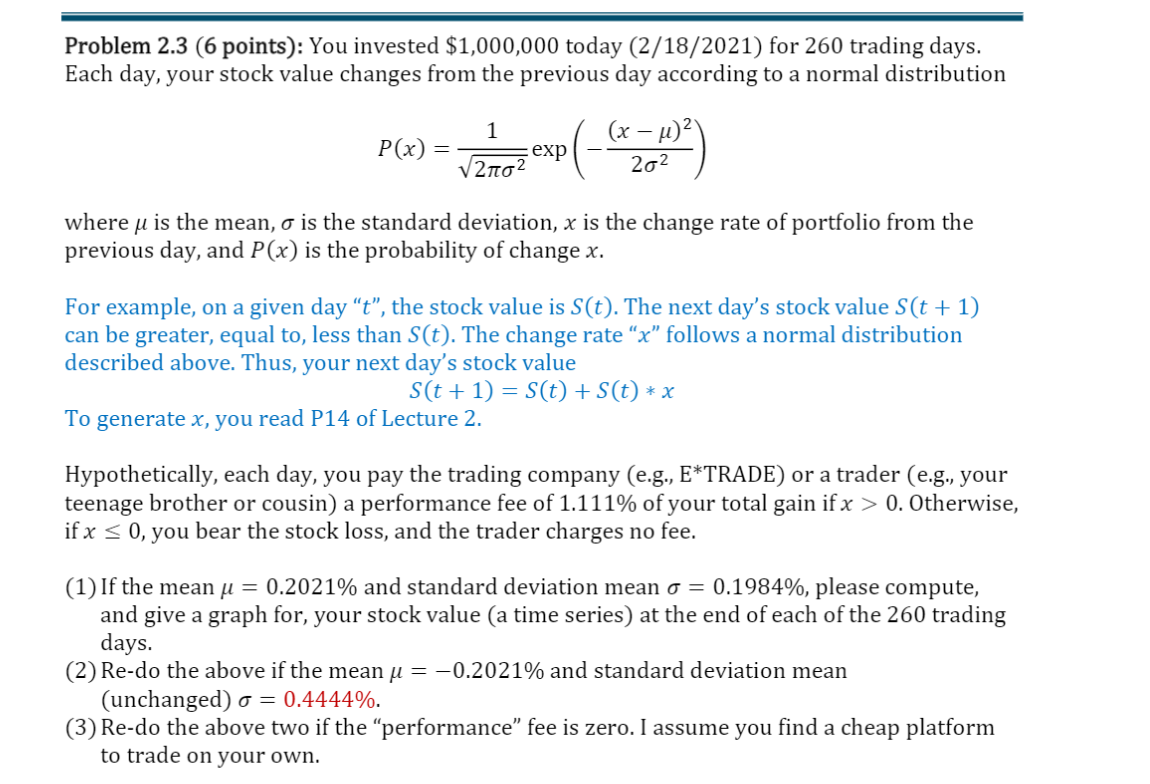
Problem 2.3 (6 points): You invested $1,000,000 today (2/18/2021) for 260 trading days. Each day, your stock value changes from the previous day according to a normal distribution P(x) = vzhoz exp(-avezno (x u) 2 202 where u is the mean, o is the standard deviation, x is the change rate of portfolio from the previous day, and P(x) is the probability of change x. For example, on a given day t, the stock value is S(t). The next day's stock value S(t + 1) can be greater, equal to, less than S(t). The change rate x follows a normal distribution described above. Thus, your next day's stock value S(t + 1) = S(t) +S(t) * x To generate x, you read P14 of Lecture 2. Hypothetically, each day, you pay the trading company (e.g., E*TRADE) or a trader (e.g., your teenage brother or cousin) a performance fee of 1.111% of your total gain if x > 0. Otherwise, if x = 0, you bear the stock loss, and the trader charges no fee. (1) If the mean u = 0.2021% and standard deviation mean o = 0.1984%, please compute, and give a graph for, your stock value (a time series) at the end of each of the 260 trading days. (2) Re-do the above if the mean u = -0.2021% and standard deviation mean (unchanged) o = 0.4444%. (3) Re-do the above two if the performance fee is zero. I assume you find a cheap platform to trade on your own. Problem 2.3 (6 points): You invested $1,000,000 today (2/18/2021) for 260 trading days. Each day, your stock value changes from the previous day according to a normal distribution P(x) = vzhoz exp(-avezno (x u) 2 202 where u is the mean, o is the standard deviation, x is the change rate of portfolio from the previous day, and P(x) is the probability of change x. For example, on a given day t, the stock value is S(t). The next day's stock value S(t + 1) can be greater, equal to, less than S(t). The change rate x follows a normal distribution described above. Thus, your next day's stock value S(t + 1) = S(t) +S(t) * x To generate x, you read P14 of Lecture 2. Hypothetically, each day, you pay the trading company (e.g., E*TRADE) or a trader (e.g., your teenage brother or cousin) a performance fee of 1.111% of your total gain if x > 0. Otherwise, if x = 0, you bear the stock loss, and the trader charges no fee. (1) If the mean u = 0.2021% and standard deviation mean o = 0.1984%, please compute, and give a graph for, your stock value (a time series) at the end of each of the 260 trading days. (2) Re-do the above if the mean u = -0.2021% and standard deviation mean (unchanged) o = 0.4444%. (3) Re-do the above two if the performance fee is zero. I assume you find a cheap platform to trade on your own
Step by Step Solution
There are 3 Steps involved in it

Get step-by-step solutions from verified subject matter experts