

Question: numerical analysis: please use matlab and show the codes Problem 1: (20 pts) The table below represents the concentration of a type of chemical compound
numerical analysis:
Problem 1: (20 pts) The table below represents the concentration of a type of chemical compound in blood stream t hours after the injection of a medicine. Consider fitting the data with the following model: y(t)=c1tc2eest (i) Use logarithmic linearization method, i.e., fitting a linear model for lny(t), to determine the model parameters c1,c2,c3. Report the parameters and the RMSE of the fitting. (ii) Use nonlinear least square method to determine the parameters c1,c2,c3. Solve the nonlinear system of equations by Gauss-Newton method with an initial guess c1=2,c2=1,c3=0. Stop the iteration when the increment in maximum norm is smaller than 106, OR when the number of iterations reaches 100 . Report the parameters and the RMSE of the fitting. (iii) Make a plot for the two model curves produced by the two methods, with given data points also marked, on one graph. (iv) Compare the RMSE for the above two methods, why the RMSE produced by the nonlinear least square method is smaller than that produced by the logarithmic linearization method? If nonlinear least square fitting is always more accurate, why do we need to use logarithmic linearization? Requirements: In addition to turning in your matlab codes and graph plots, you also need to submit screen shots for your matlab outputs please use matlab and show the codes 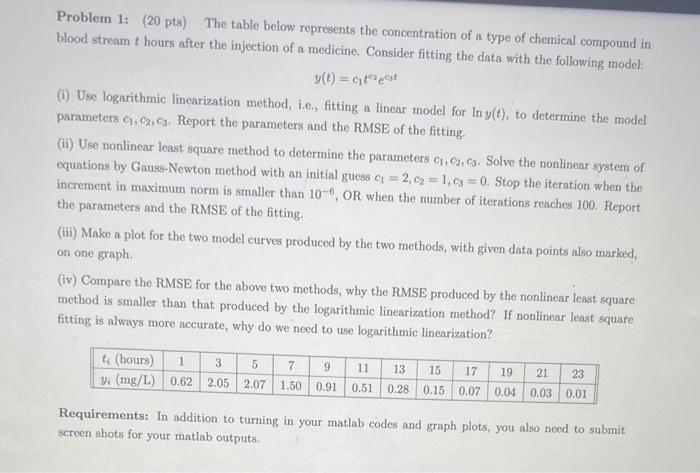
Step by Step Solution
There are 3 Steps involved in it
1 Expert Approved Answer
Step: 1 Unlock

Question Has Been Solved by an Expert!
Get step-by-step solutions from verified subject matter experts
Step: 2 Unlock
Step: 3 Unlock