

Question: NVIDIA Corp Income Statements are presented below. Analysts forecast that its 2018 sales will be $8,260. The expected 2018 tax rate will be 17.35%. Assume
NVIDIA Corp Income Statements are presented below. Analysts forecast that its 2018 sales will be $8,260. The expected 2018 tax rate will be 17.35%.
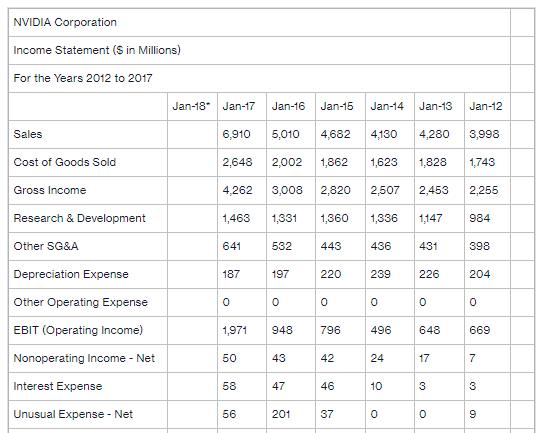
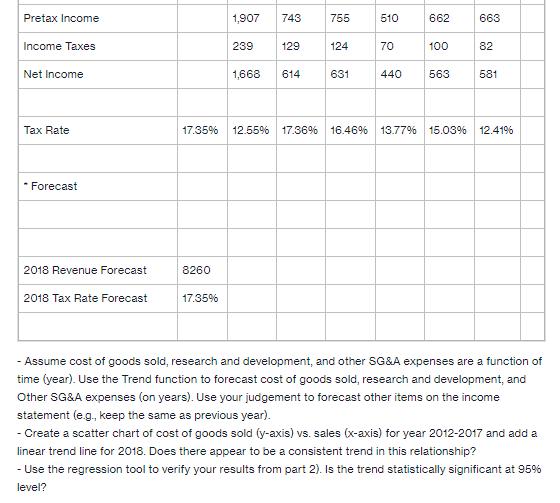
Assume cost of goods sold, research and development, and other SG&A expenses are a function of time (year). Use the Trend function to forecast cost of goods sold, research and development, and Other SG&A expenses (on years).
COGS: $
Research and Development: $
Other SG&A expenses: $
From your scatter plot trend line and regression analysis of COGS vs Sales, does there appear to be a consistent trend in this relationship?
Is the trend statistically significant at the 5% level?
NVIDIA Corporation Income Statement ($ in Millions) For the Years 2012 to 2017 Sales Cost of Goods Sold Gross Income Research & Development Other SG&A Depreciation Expense Other Operating Expense EBIT (Operating Income) Nonoperating Income - Net Interest Expense Unusual Expense - Net Jan-18 Jan-17 Jan-16 Jan-15 6,910 5,010 4,682 3,998 2,648 2,002 1,862 1,623 1,828 1,743 4,262 3,008 2,820 2,507 2,453 1,463 1,331 1,360 1,336 1,147 532 443 431 197 226 641 187 0 1,971 50 58 56 0 948 43 47 220 O 42 Jan-14 Jan-13 4,130 4,280 46 201 37 436 796 496 239 0 24 10 0 O 648 17 3 Jan-12 0 2,255 984 398 204 0 669 7 3 9
Step by Step Solution
3.38 Rating (145 Votes )
There are 3 Steps involved in it
Below is the forecast for Jan2018 For COGS RD SGA I have used the trend function i have shared the trend function formula used to get the values To ex... View full answer

Get step-by-step solutions from verified subject matter experts