Question: nwmissouri.e X N Access your B X Module 3 X Microsoft Col X Search Result X ucture.com/courses/65123/assignments/1080323 Instructions: Click here to download the Application Assignment
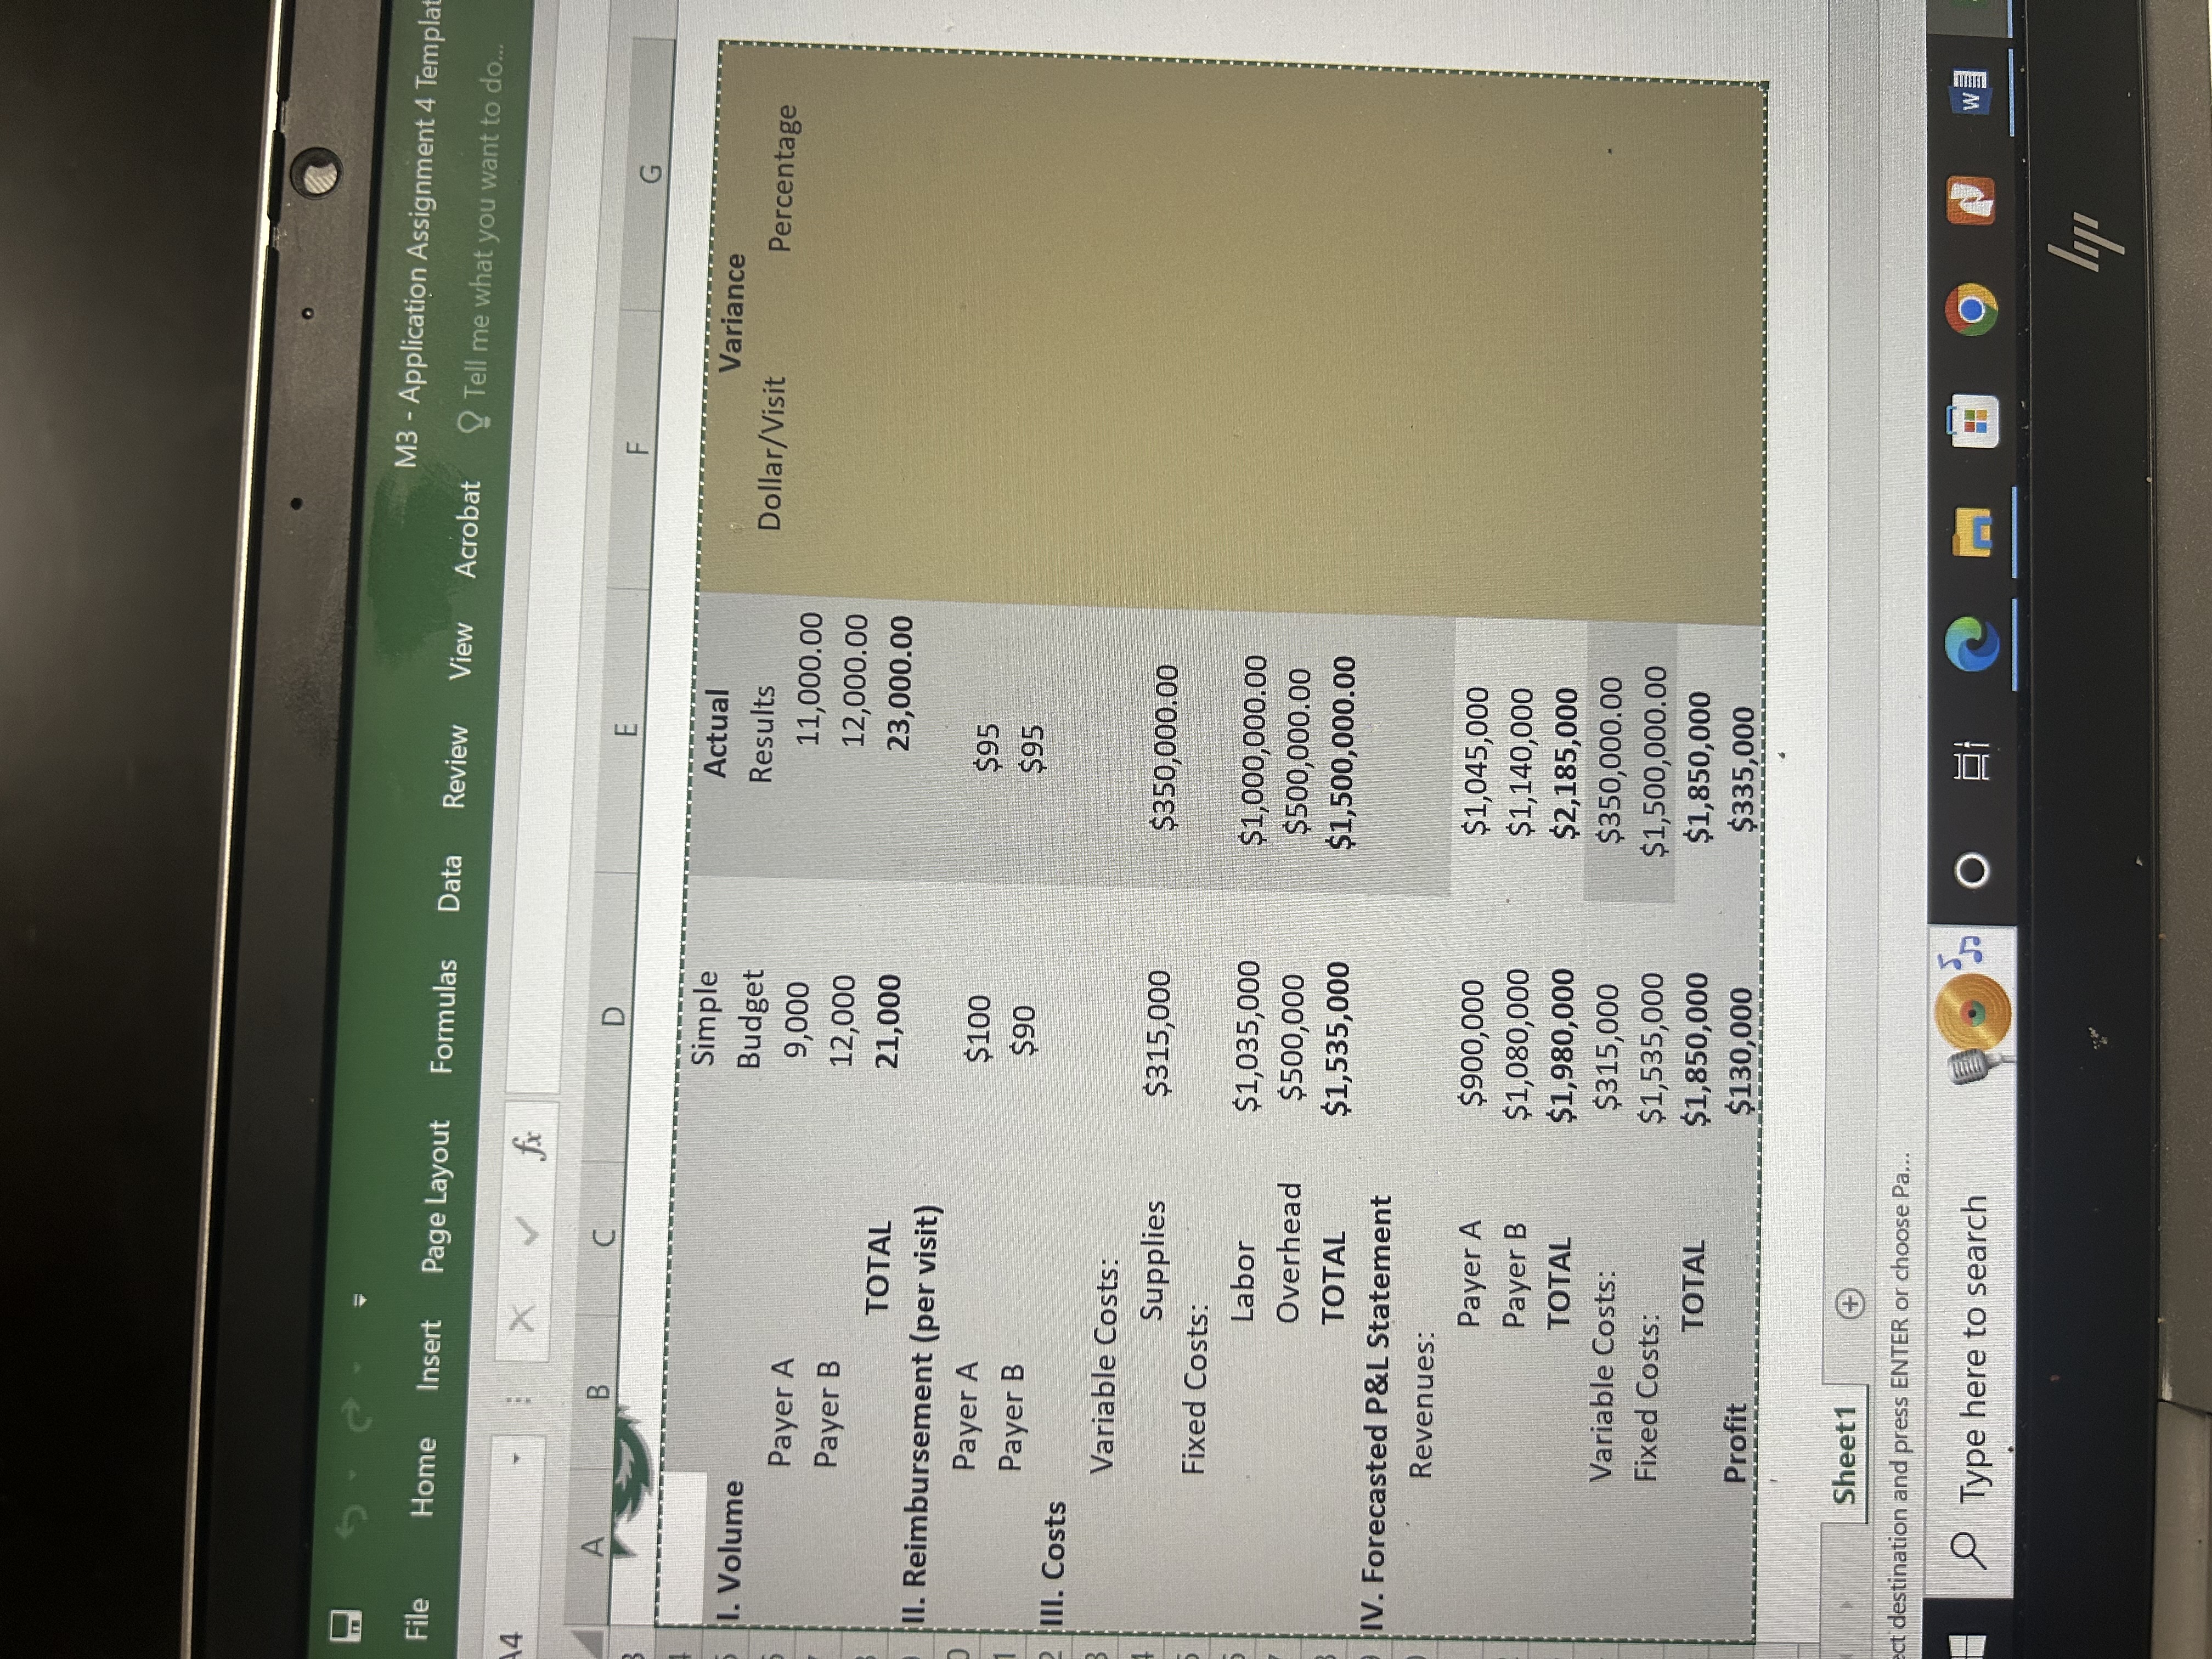
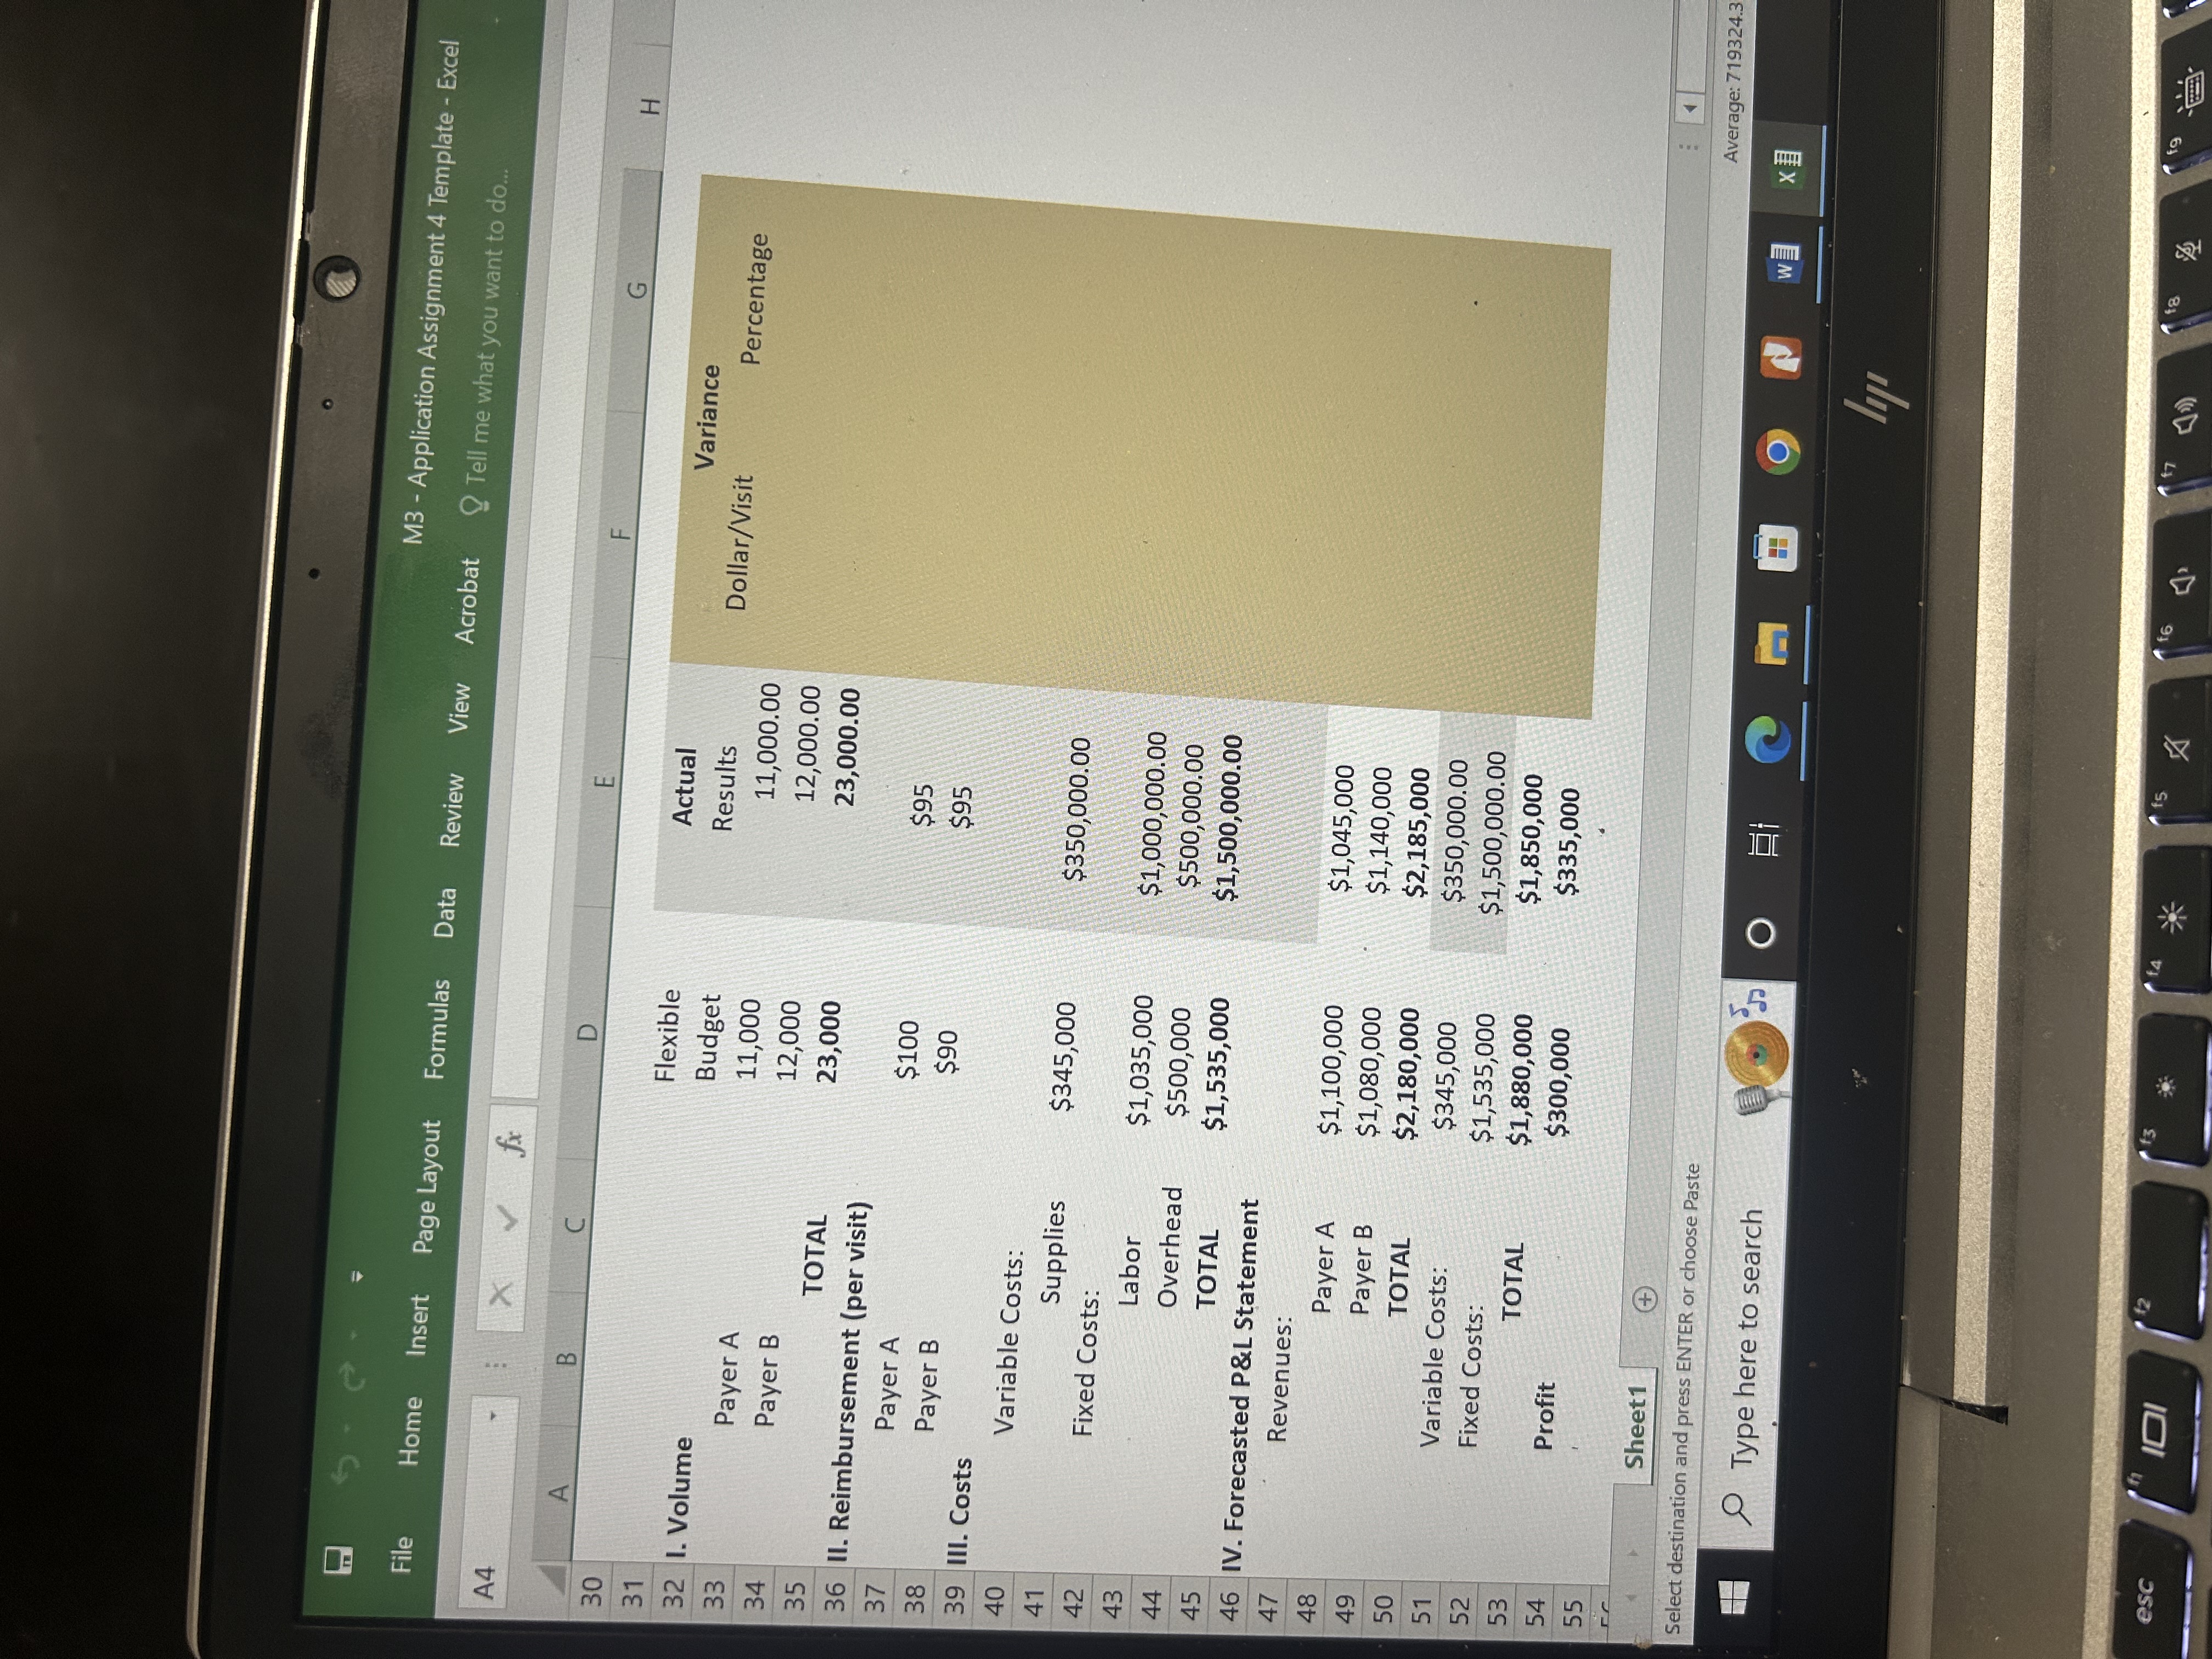
nwmissouri.e X N Access your B X Module 3 X Microsoft Col X Search Result X ucture.com/courses/65123/assignments/1080323 Instructions: Click here to download the Application Assignment #4 Excel template & For this assignment, you will use the Excel template to complete two different variance analyses - one for a simple budget and one for a flexible budget. For both tables, the initial values for simple/flexible have already been provided for you. In the table below, you are provided with the actual results that you'll need to plug in for your variance analysis. Step One: In the actual results column (shaded in gray), enter the actual results provided in the table below for each table. Pay close attention to where you are entering the values - if you enter these in the wrong cell, it will affect your analysis! Step Two: In the variance columns (shaded in tan), you will calculate the variance between the simple/actual results for table one and the flexible/actual results for table two. In the first column, you'll enter the actual variance (either visit count or dollar amount). In the second column, you will need to calculate the percentage of variance. 1. Volume (Number of Visits) Payer A: 11,000 Payer B: 12,000 50OF Cloudy OM3 - Application Assignment 4 Templat File Home Insert Page Layout Formulas Data Review View Acrobat Tell me what you want to do. 14 A B C D E F G Simple Actual Variance 1. Volume Budget Results Dollar/Visit Percentage Payer A 9,000 11,000.00 Payer B 12,000 12,000.00 TOTAL 21,000 23,000.00 Il. Reimbursement (per visit) Payer A $100 $95 Payer B $90 $95 Ill. Costs Variable Costs: Supplies $315,000 $350,000.00 Fixed Costs: Labor $1,035,000 $1,000,000.00 Overhead $500,000 $500,000.00 TOTAL $1,535,000 $1,500,000.00 IV. Forecasted P&L Statement Revenues: Payer A $900,000 $1,045,000 Payer B $1,080,000 $1,140,000 TOTAL $1,980,000 $2,185,000 Variable Costs: $315,000 $350,000.00 Fixed Costs: $1,535,000 $1,500,000.00 TOTAL $1,850,000 $1,850,000 Profit $130,000 $335,000 Sheet1 + ct destination and press ENTER or choose Pa... Type here to search OM3 - Application Assignment 4 Template - Excel File Home Insert Page Layout Formulas Data Review View Acrobat Tell me what you want to do. A4 X V fx A B C D E F G 30 H 31 Flexible Actual Variance 32 1. Volume Budget Results Dollar/Visit Percentage 33 Payer A 11,000 11,000.00 34 Payer B 12,000 12,000.00 35 TOTAL 23,000 23,000.00 36 II. Reimbursement (per visit) 37 Payer A $100 $95 38 Payer B $90 $95 39 Ill. Costs 40 Variable Costs: 41 Supplies $345,000 $350,000.00 42 Fixed Costs: 43 Labor $1,035,000 $1,000,000.00 44 Overhead $500,000 $500,000.00 45 TOTAL $1,535,000 $1,500,000.00 46 IV. Forecasted P&L Statement 47 Revenues: 48 Payer A $1,100,000 $1,045,000 49 Payer B $1,080,000 $1,140,000 50 TOTAL $2,180,000 $2,185,000 51 Variable Costs: $345,000 $350,000.00 52 Fixed Costs: $1,535,000 $1,500,000.00 53 TOTAL $1,880,000 $1,850,000 54 Profit $300,000 $335,000 55 rc Sheet1 + Select destination and press ENTER or choose Paste Average: 719324. Type here to search O EM XI $7 18 19 esc
Step by Step Solution
There are 3 Steps involved in it
1 Expert Approved Answer
Step: 1 Unlock
Question Has Been Solved by an Expert!
Get step-by-step solutions from verified subject matter experts
Step: 2 Unlock
Step: 3 Unlock
Students Have Also Explored These Related Accounting Questions!