

Question: o 2. (adapted from Lectolter and Swersey, Chapter 4, Exercise 6) Meredith Corporation, the publisher of Ladies Home Journal magazine, sends more than a million
o
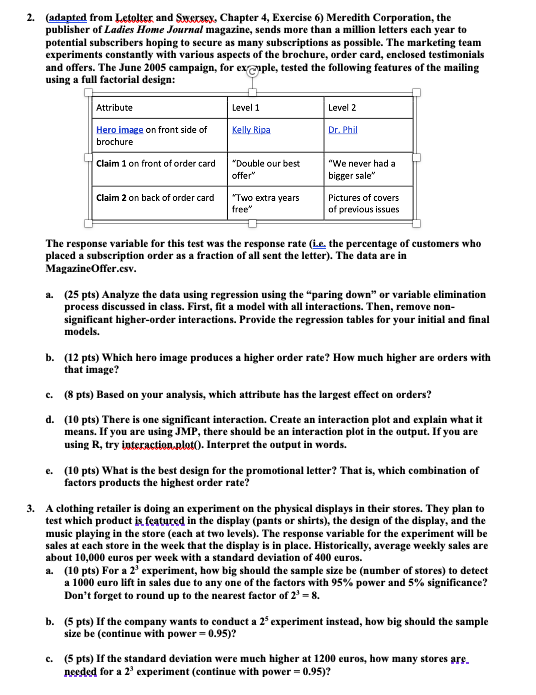
2. (adapted from Lectolter and Swersey, Chapter 4, Exercise 6) Meredith Corporation, the publisher of Ladies Home Journal magazine, sends more than a million letters each year to potential subscribers hoping to secure as many subscriptions as possible. The marketing team experiments constantly with various aspects of the brochure, order card, enclosed testimonials and offers. The June 2005 campaign, for example, tested the following features of the mailing using a full factorial design: Attribute Level 1 Level 2 Hero image on front side of Kelly Ripa Dr. Phil brochure Claim 1 on front of order card "Double our best "We never had a offer" bigger sale" Claim 2 on back of order card "Two extra years Pictures of covers free" of previous issues The response variable for this test was the response rate (Le. the percentage of customers who placed a subscription order as a fraction of all sent the letter). The data are in MagazineOffer.cav. a. (25 pts) Analyze the data using regression using the "paring down" or variable elimination process discussed in class. First, fit a model with all interactions. Then, remove non- significant higher-order interactions. Provide the regression tables for your initial and final models. b. (12 pts) Which hero image produces a higher order rate? How much higher are orders with that image? c. (8 pts) Based on your analysis, which attribute has the largest effect on orders? d. (10 pts) There is one significant interaction. Create an interaction plot and explain what it means. If you are using JMP, there should be an interaction plot in the output. If you are using R, try interaction plot(). Interpret the output in words. C. (10 pts) What is the best design for the promotional letter? That is, which combination of factors products the highest order rate? 3. A clothing retailer is doing an experiment on the physical displays in their stores. They plan to test which product is featured in the display (pants or shirts), the design of the display, and the music playing in the store (each at two levels). The response variable for the experiment will be sales at cach store in the week that the display is in place. Historically, average weekly sales are about 10,000 curos per week with a standard deviation of 400 euros. a. (10 pts) For a 2' experiment, how big should the sample size be (number of stores) to detect a 1000 euro lift in sales due to any one of the factors with 95% power and 5% significance? Don't forget to round up to the nearest factor of 2' = 8. b. (5 pts) If the company wants to conduct a 25 experiment instead, how big should the sample size be (continue with power = 0.95)? c. (5 pts) If the standard deviation were much higher at 1200 euros, how many stores are. needed for a 2' experiment (continue with power = 0.95)
Step by Step Solution
There are 3 Steps involved in it

Get step-by-step solutions from verified subject matter experts